The status monitor – GAI-Tronics Sonic Alarm Sonic Alarm System Software Programming and User Manual User Manual
Page 96
Pub. 42004-410A
Sonic Alarm™ System Programming and User Manual
Page: 93 of 98
f:\standard ioms - current release\42004 instr. manuals\42004-410a.doc
03/09
The Status Monitor
The Status Monitor provides a real-time snapshot of the MapGUI Control Center activity. It is separated
into three tabs, one for each type of event that may be active in your system (alarms, pages and faults).
The Status Monitor button (on the main toolbar) will flash red at times. This is to alert the user that a new
fault has been reported in the system since the last time the Status Monitor was viewed. Once you view a
reported fault, and it has been acknowledged (by you viewing it), the button appearance will return from
its red pulsing state to a solid red state. The button will return to a silver color when there are no active
events in the status window.
Each tab has specific information about the events in progress and each tab as well as each data field will
be discussed in detail. In addition to being used to select or filter current status information, tabs can
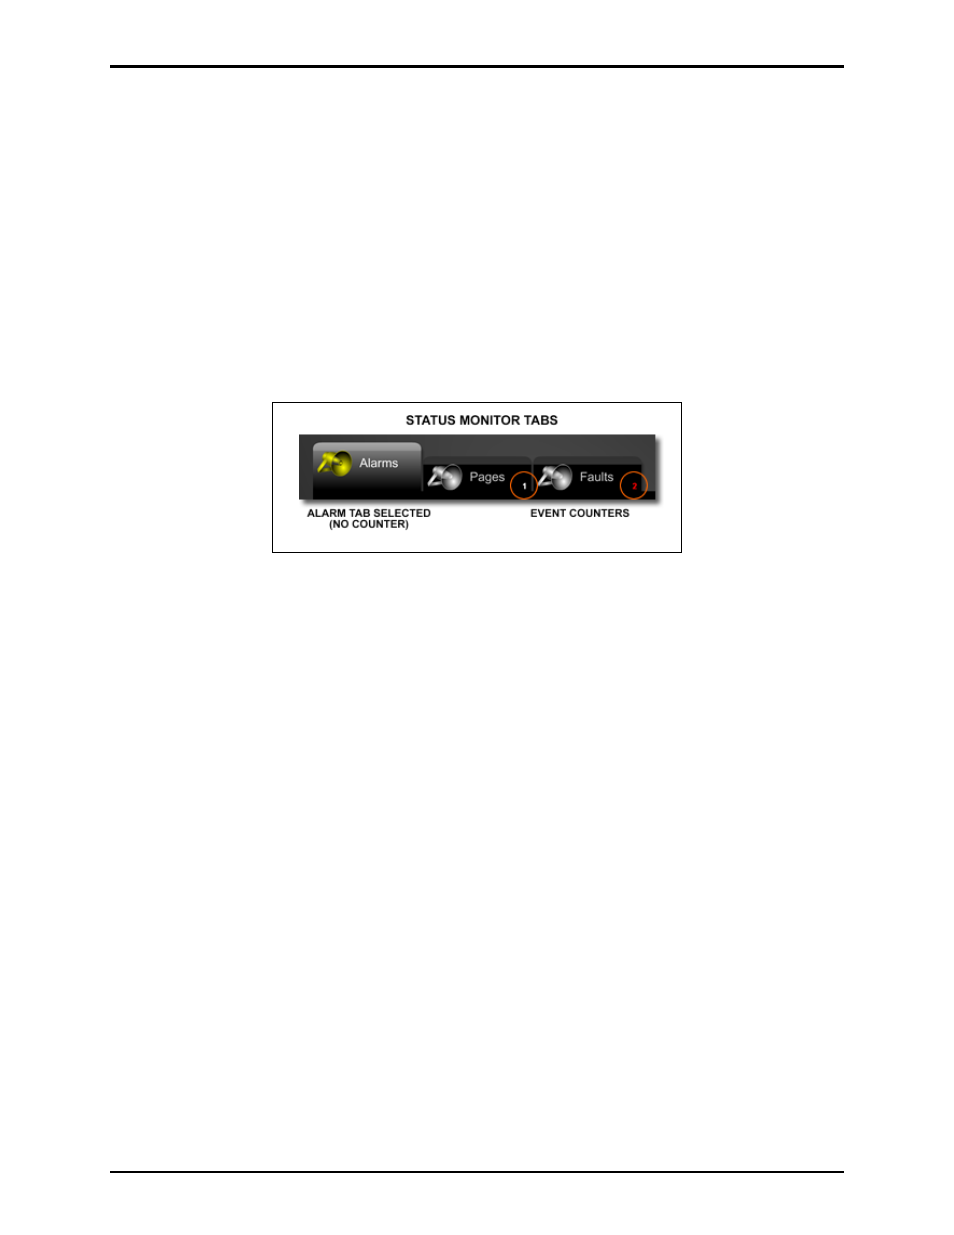
provide a quick at-a-glance look at how many events are active on a given tab.
Figure 27. Status Monitor Tabs
By looking at this we can tell that there is one page event active and two faults reported. By selecting the
appropriate tab, we can get more detailed information on the status of the system.