Measurement history, Measurement result display type, Measurement history -32 – RIGOL MSO/DS1000Z Series User Manual
Page 146: Measurement result display type -32
RIGOL
Chapter 6 MATH and Measurement
6-32
MSO1000Z/DS1000Z User’s Guide
Measurement History
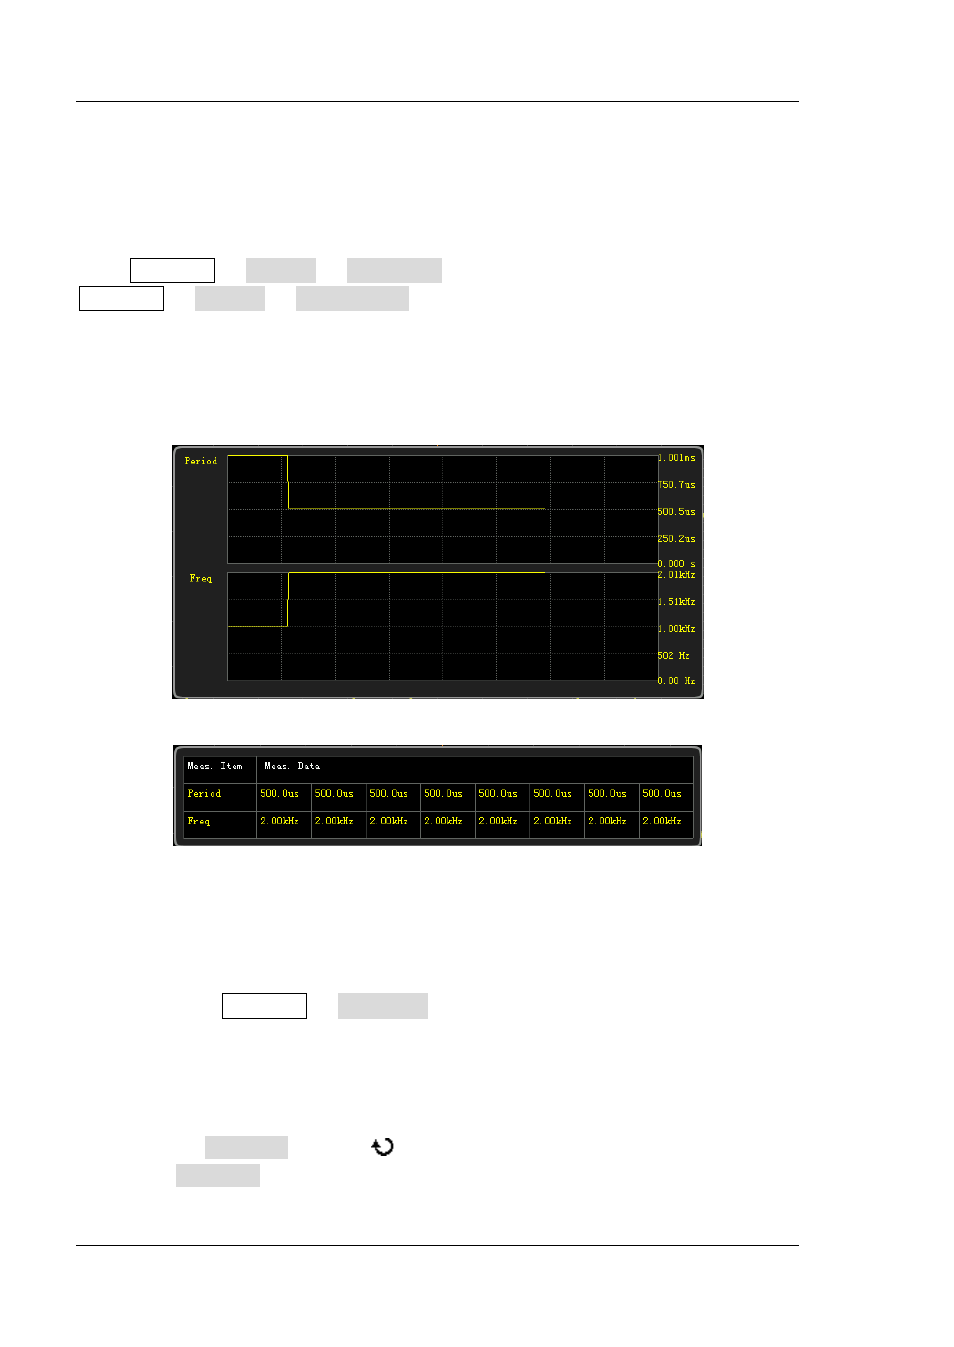
The measurement history function can display the history measurement data of the
measurement items currently turned on in graph or table form.
Press Measure History Disp Type to select "Graph" or "Table". Press
Measure History DispHistory to turn on or off the measurement history
function. In "Graph" display mode, the oscilloscope draws the measurement value
curve in real time with the horizontal axis denoting time and the vertical axis
denoting the measurement value. In "Table" display mode, the oscilloscope displays
the 8 latest measurement values in real time. As shown in the figures below.
Graph
Table
Measurement Result Display Type
The measurement results can be displayed at the bottom of the screen in various
font sizes. Press Measure Font Size to select "Normal", "Large" or "Extra
Large".
When "Normal" is selected, the measurement results of at most 5 measurement
items that are turned on last can be displayed at the bottom of the screen.
When "Large" or "Extra Large" is selected, the number of measurement results
can be displayed at the bottom of the screen will be affected. At this point, you
can press Sel.Item and use
to select the measurement item to be viewed.
Note:
Sel.Item is not available when no measurement item is turned on.