Cpu load – Niveo Professional NGSME16T2H User Manual
Page 269
Advertising
Chapter 5: Monitor, Diagnostic, Maintenance
Monitor, Diagnostic, Maintenance
NGSME16T2H User Manual | 269
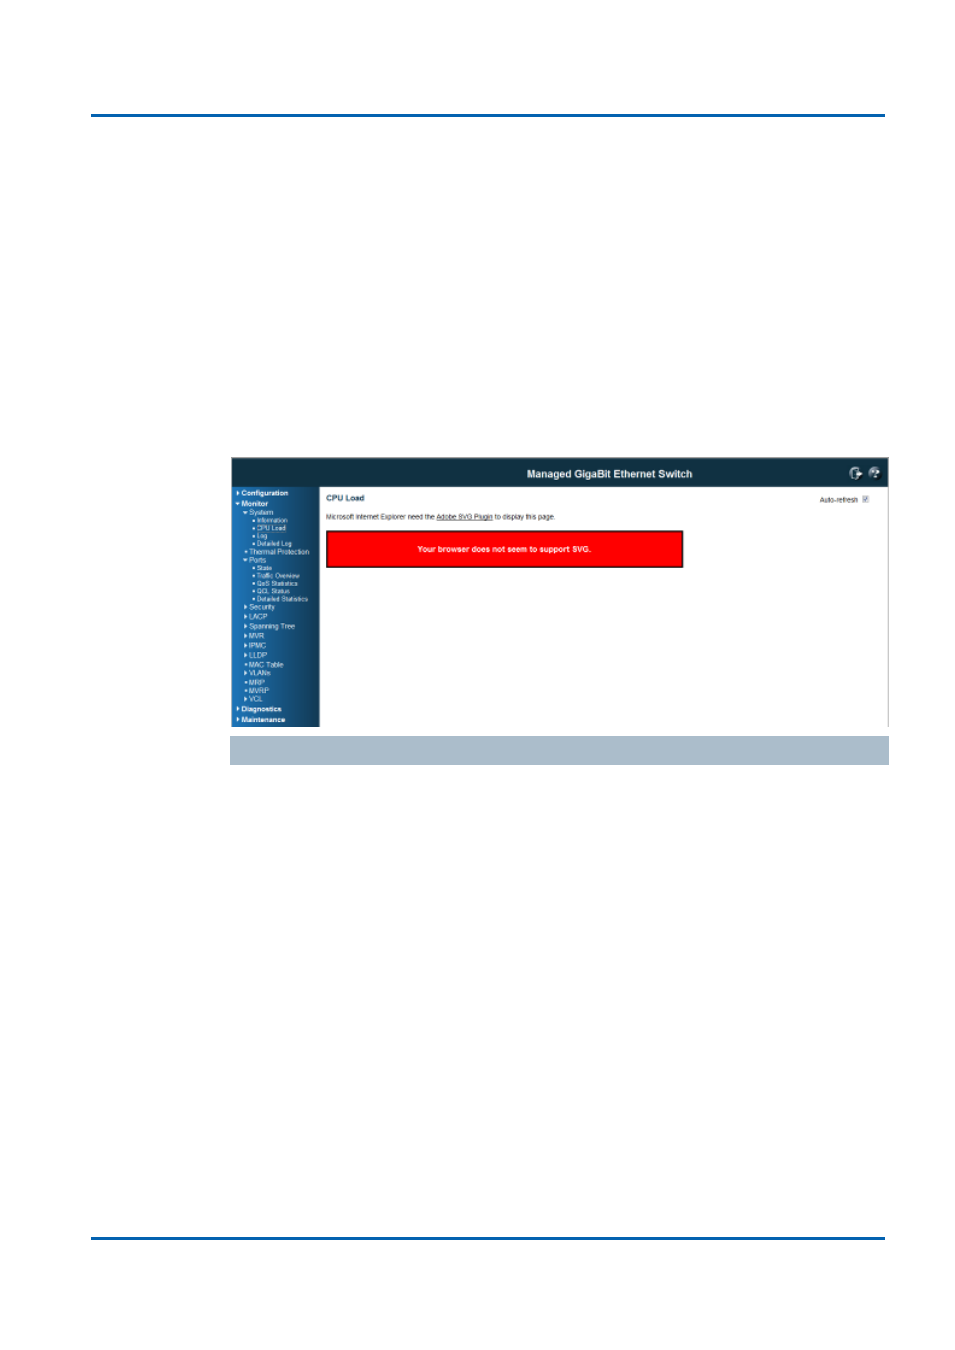
CPU Load
This page displays the CPU load, using an SVG graph.
The load is measured as averaged over the last 100ms, 1sec and 10 seconds
intervals. The last 120 samples are graphed, and the last numbers are displayed as
text as well.
In order to display the SVG graph, your browser must support the SVG format.
Consult the SVG Wiki for more information on browser support. Specifically, at the
time of writing, Microsoft Internet Explorer will need to have a plugin installed to
support SVG.
Buttons
Auto-refresh: Check this box to enable an automatic refresh of the page at regular
intervals.
Advertising
This manual is related to the following products: