Rmon statistics configuration – Niveo Professional NGSME16T2H User Manual
Page 60
Chapter 3: Featuring Configuration
– Web UI
Featuring Configuration
– Web UI
NGSME16T2H User Manual | 60
RMON Statistics Configuration
RMON is short of Remote Monitoring On Network. An RMON implementation
typically operates in a client/server model. Monitoring device (Probe) contains
RMON software agents that collect information of the system and ports. The RMON
software agent acts as server, and the network management system (NMS) that
communicate with it acts as client. The RMON agent of the switch supports 4 groups,
such as the Statistics, History, Alarm and Event.
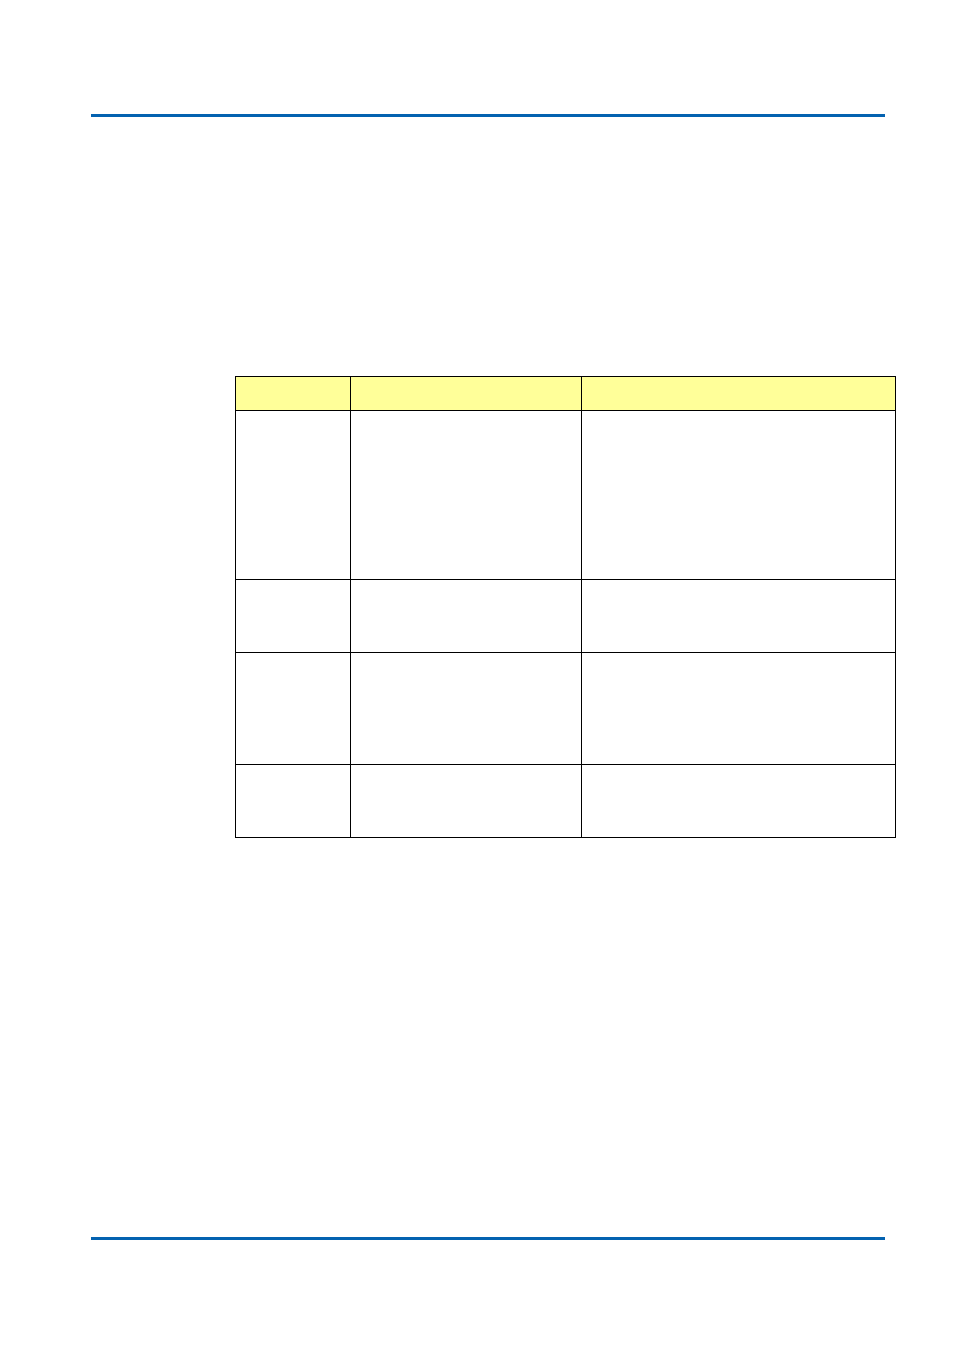
RMON Group
Function
Elements
Statistics
Contains statistics measured
by the probe for each
monitored interface on this
device.
Real-time LAN statistics e.g.
utilization, collisions, CRC errors
Packets dropped, packets sent, bytes
sent (octets), broadcast packets,
multicast packets, CRC errors, undersize
packets, oversize packets, fragments,
jabbers, collisions, and counters for
packets ranging from 64, 65 to 127, 128
to 255, 256 to 511, 512 to 1023, and 1024
to 1518 bytes.
History
Records periodic statistical
samples from a network and
stores for retrieval.
History of above Statistics.
Alarm
Definitions for RMON SNMP
traps to be sent when statistics
exceed defined thresholds
Interval for sampling, particular variable,
sample type, value of statistics during the
last sampling period, startup alarm, rising
threshold, rising index, falling threshold,
falling index.
Events
Controls the generation and
notification of events from this
device.
Event index, log index, event log time,
event description
The NMS can get the above information through remotely polling. The information
from the switch can be collected, analyzed and displayed as table or graphic...etc.