Viewing port communication status, Opening the session configuration menu, Data analyzer – ProSoft Technology PTQ-101M User Manual
Page 101: Analyzing data for the first application port, Analyzing data for the second application port, Displaying timing marks in the data analyzer
Diagnostics and Troubleshooting
PTQ-101M ♦ Quantum Platform
IEC 60870-5-101 Master Communication Module
ProSoft Technology, Inc.
Page 101 of 181
May 14, 2008
Viewing Port Communication Status
Press [Q] to view the port communication status for the application port.
Use this command to view communication status and statistics for the selected
port. This information can be informative when trouble-shooting communication
problems.
Opening the Session Configuration Menu
Press [S] to open the Session Configuration menu. Use this command to view
the session configuration data.
Refer to Session Configuration Menu for more information about the commands
on this menu.
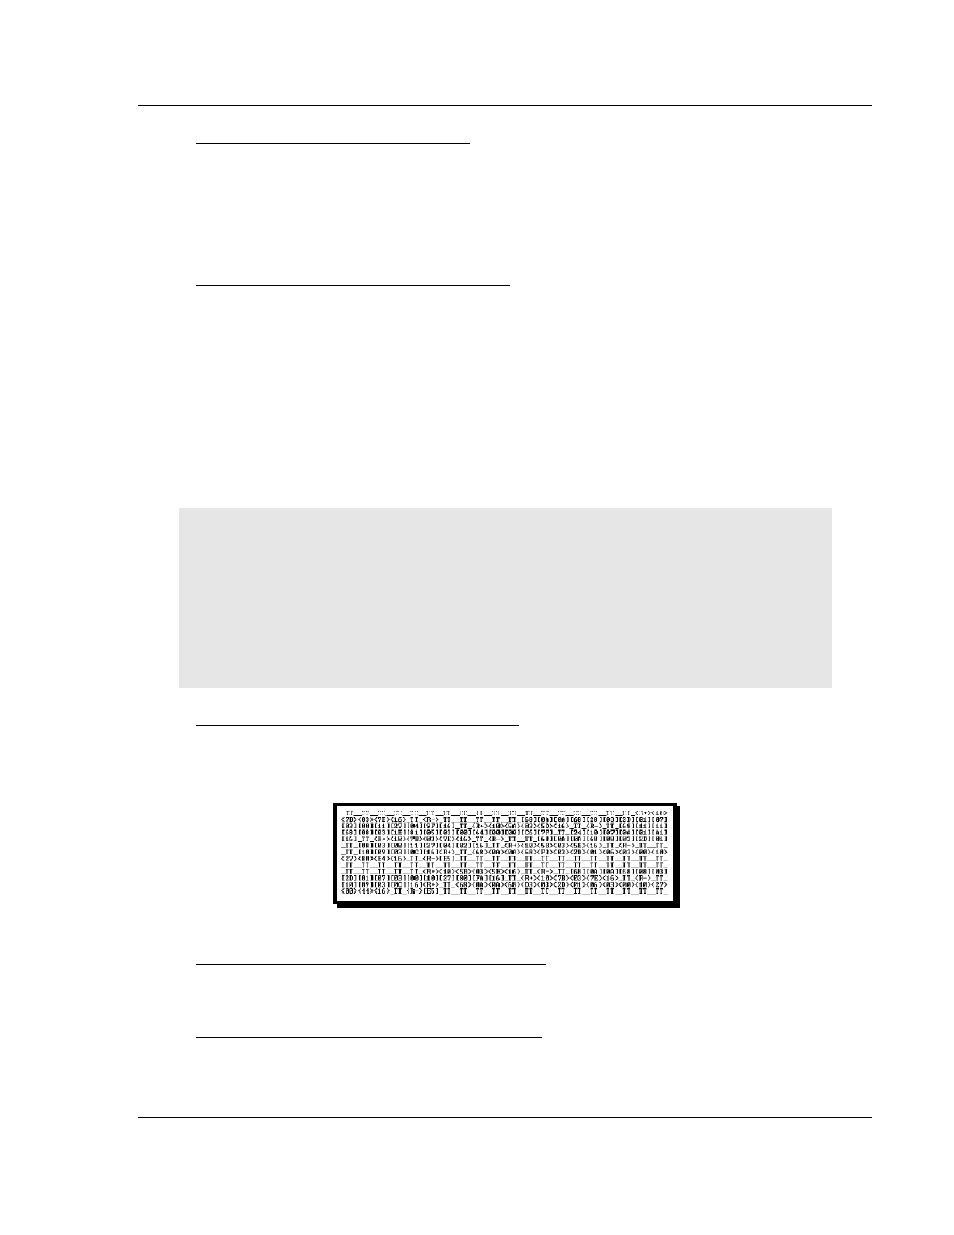
6.4.4 Data
Analyzer
The data analyzer mode allows you to view all bytes of data transferred on each
port. Both the transmitted and received data bytes are displayed. Use of this
feature is limited without a thorough understanding of the protocol.
Note: The Port selection commands on the Data Analyzer menu differs very slightly in different
modules, but the functionality is basically the same. Use the illustration above as a general guide
only. Refer to the actual data analyzer menu on your module for the specific port commands to
use.
Important: When in analyzer mode, program execution will slow down. Only use this tool during a
troubleshooting session. Before disconnecting from the Config/Debug port, please press [S] to stop
the data analyzer, and then press [M] to return to the main menu. This action will allow the module
to resume its normal high speed operating mode.
Analyzing Data for the first application port
Press [1] to display I/O data for the first application port in the Data Analyzer.
The following illustration shows an example of the Data Analyzer output.
Analyzing Data for the second application port
Press [2] to display I/O data for the second application port in the Data Analyzer.
Displaying Timing Marks in the Data Analyzer
You can display timing marks for a variety of intervals in the data analyzer
screen. These timing marks can help you determine communication-timing
characteristics.