Yaskawa i80M Connecting Manual User Manual
Page 159
Advertising
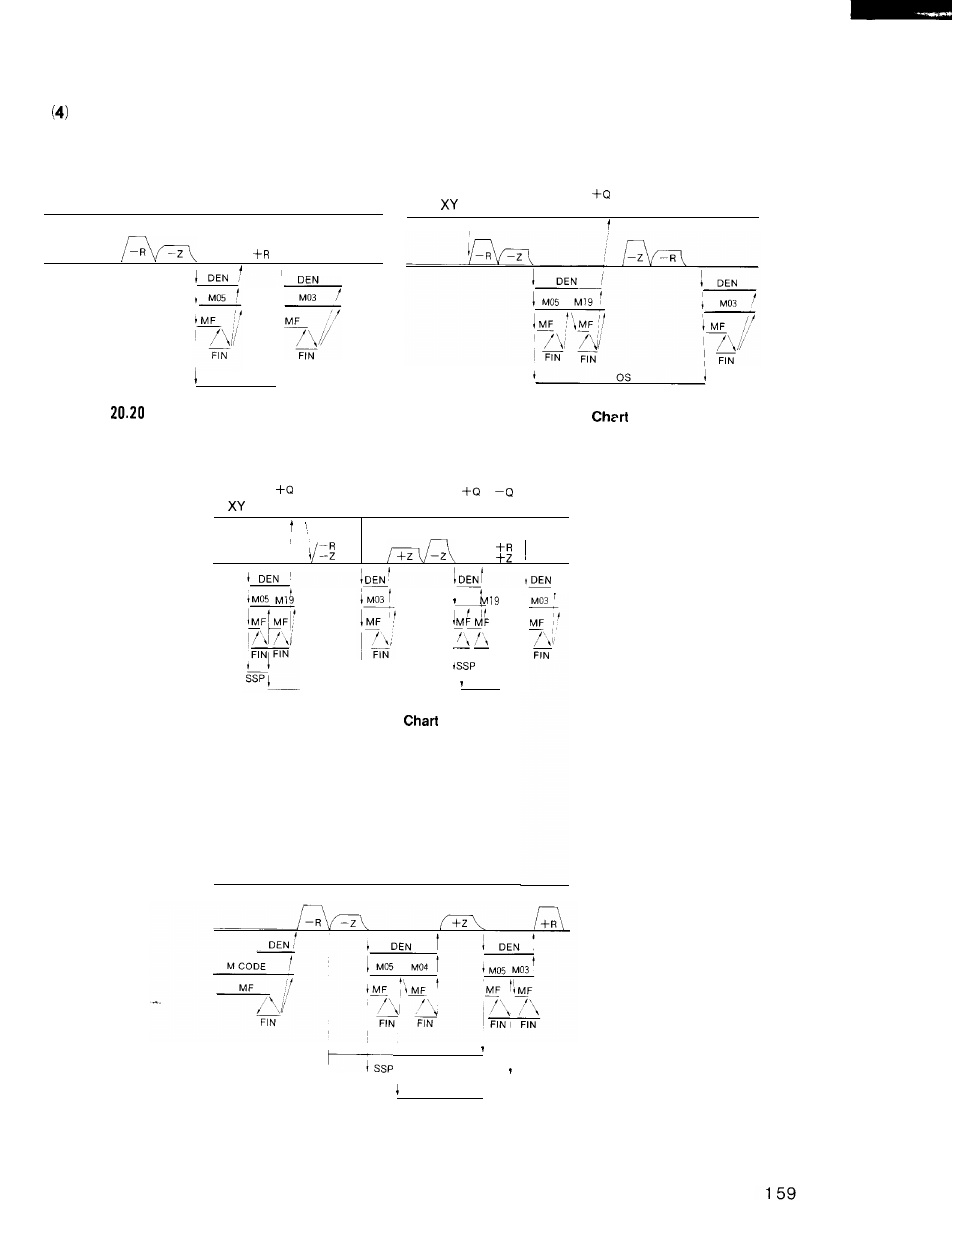
Canned Cycle on M Code
The time charts of M code during canned cycles are shown below,
XY
SSP
Fig.
Time Chart of G86 to G88
–Q
I
Fig. 20.21 Time
of G76
– Q
0s
M05
FIN FIN
—
0 s
Fig. 20.22 Time
of G77
The time chart of M code during canned is shown below.
XY
I
I
SSP
SRV
Fig. 20.23 Time Chart of M Code during Canned Cycle
Advertising
See also other documents in the category Yaskawa Equipment:
- Tag Generator (30 pages)
- MP3300iec (82 pages)
- 1000 Hz High Frequency (18 pages)
- 1000 Series (7 pages)
- PS-A10LB (39 pages)
- iQpump Micro User Manual (300 pages)
- 1000 Series Drive Option - Digital Input (30 pages)
- 1000 Series Drive Option - CANopen (39 pages)
- 1000 Series Drive Option - Analog Monitor (27 pages)
- 1000 Series Drive Option - CANopen Technical Manual (37 pages)
- 1000 Series Drive Option - CC-Link (38 pages)
- 1000 Series Drive Option - CC-Link Technical Manual (36 pages)
- 1000 Series Drive Option - DeviceNet (37 pages)
- 1000 Series Drive Option - DeviceNet Technical Manual (81 pages)
- 1000 Series Drive Option - MECHATROLINK-II (32 pages)
- 1000 Series Drive Option - Digital Output (31 pages)
- 1000 Series Drive Option - MECHATROLINK-II Technical Manual (41 pages)
- 1000 Series Drive Option - Profibus-DP (35 pages)
- AC Drive 1000-Series Option PG-RT3 Motor (36 pages)
- Z1000U HVAC MATRIX Drive Quick Start (378 pages)
- 1000 Series Operator Mounting Kit NEMA Type 4X (20 pages)
- 1000 Series Drive Option - Profibus-DP Technical Manual (44 pages)
- CopyUnitManager (38 pages)
- 1000 Series Option - JVOP-182 Remote LED (58 pages)
- 1000 Series Option - PG-X3 Line Driver (31 pages)
- SI-EN3 Technical Manual (68 pages)
- JVOP-181 (22 pages)
- JVOP-181 USB Copy Unit (2 pages)
- SI-EN3 (54 pages)
- SI-ET3 (49 pages)
- MECHATROLINK-III (35 pages)
- EtherNet/IP (50 pages)
- SI-EM3 (51 pages)
- 1000-Series Option PG-E3 Motor Encoder Feedback (33 pages)
- 1000-Series Option SI-EP3 PROFINET (56 pages)
- PROFINET (62 pages)
- AC Drive 1000-Series Option PG-RT3 Motor (45 pages)
- SI-EP3 PROFINET Technical Manual (53 pages)
- A1000 Drive Option - BACnet MS/TP (48 pages)
- 120 Series I/O Modules (308 pages)
- A1000 12-Pulse (92 pages)
- A1000 Drive Software Technical Manual (16 pages)
- A1000 Quick Start (2 pages)
- JUNMA Series AC SERVOMOTOR (1 page)
- A1000 Option DI-101 120 Vac Digital Input Option (24 pages)