Connection utilization, Acl utilization – H3C Technologies H3C Intelligent Management Center User Manual
Page 19
11
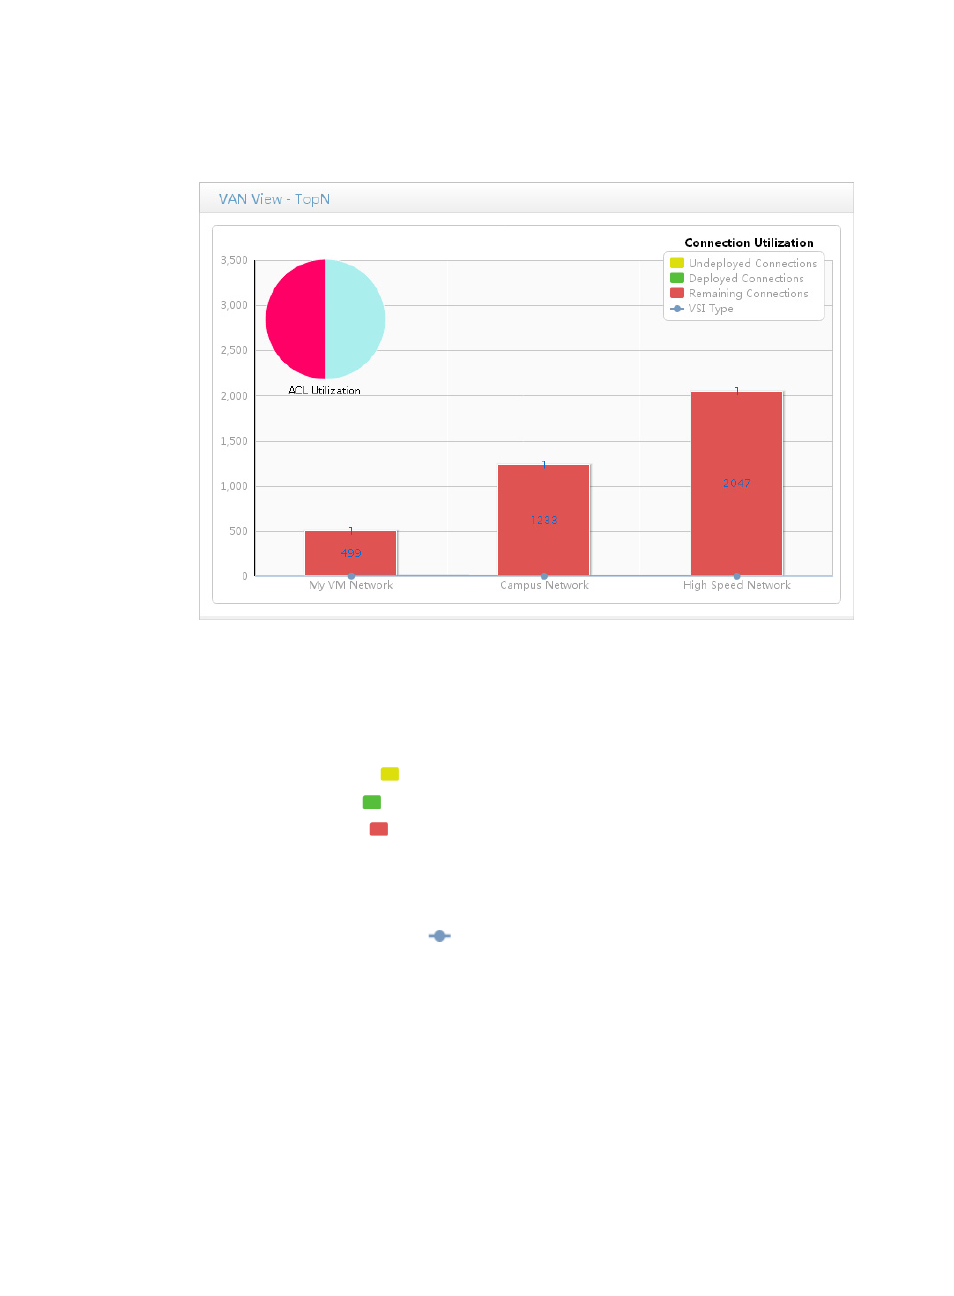
the network names. The pie chart at the top left displays the ACL utilization of edge switches
managed by VCM.
Figure 4 VAN View – TopN widget
Connection utilization
The connection utilization bar chart displays the numbers of the following types of connections for each
network:
•
Undeployed Connections
•
Deployed Connections
•
Remaining Connections
You can perform the following operations on the chart:
•
Place the cursor over a colored area to view the VLAN ID and percentage of the connection type
to the total configurable connections of the network.
•
Place the cursor over a VSI node
on the chart to view the number of VSI types and the VLAN
ID of the network.
•
Click a legend icon in the Connection Utilization area to hide or show data of that type.
ACL utilization
The pie chart displays the ACL utilization of all managed edge switches in VCM. Each edge switch is
represented by a colored slice with a size proportional to the total number of ACLs the switch can assign
to VCM. Place the cursor over a slice to view the device label and ACL utilization of the edge switch. The
ACL utilization data includes the total assignable ACLs, number of used ACLs, and ACL usage