Fluke Biomedical VT Mobile User Manual
Page 70
VT MOBILE
Operators Manual
A-4
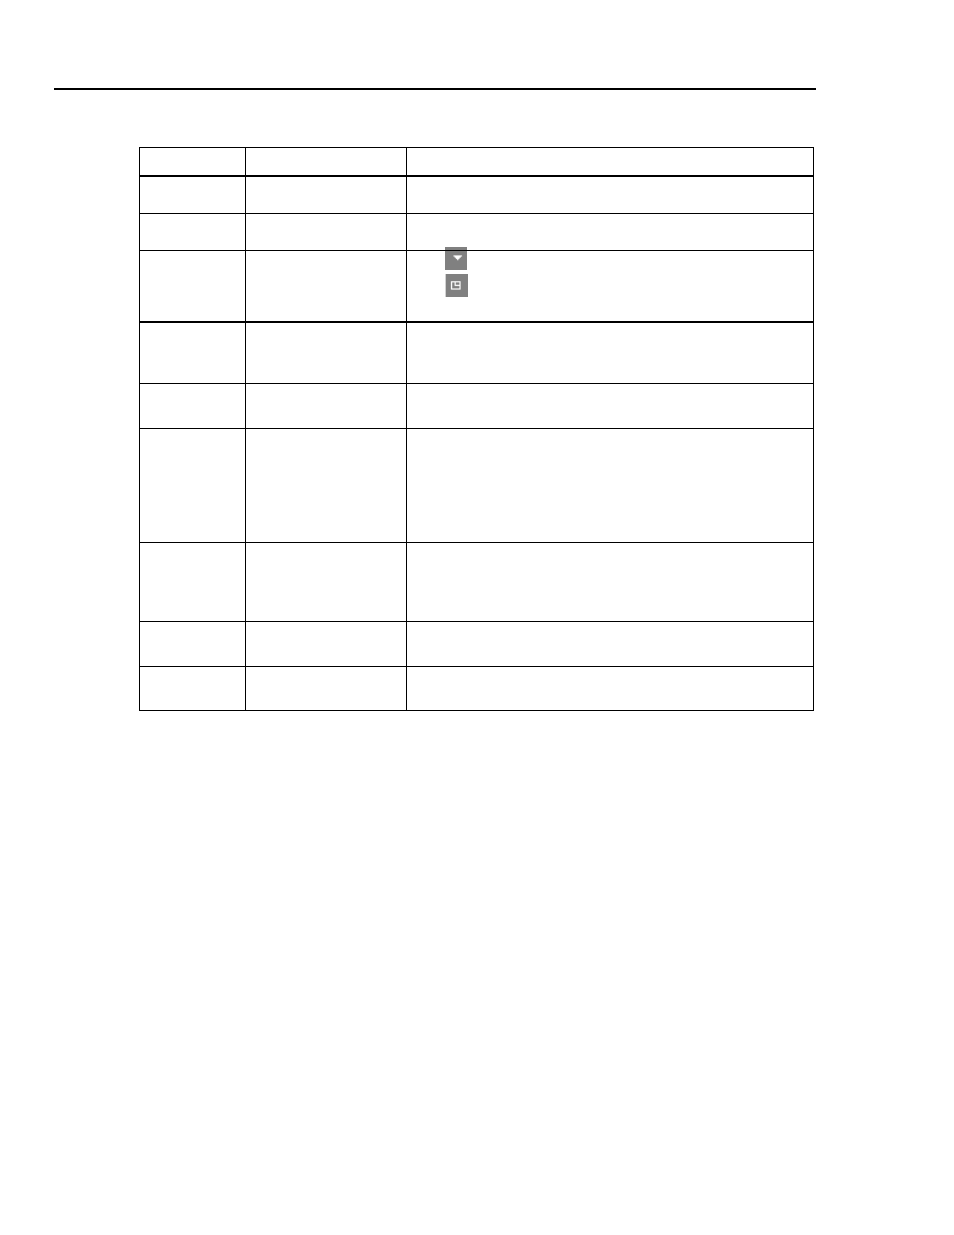
Table A-1. Screen Elements
Number Name
Description
A
Menu
Access most functions through the menu.
B
Toolbar
Buttons on the toolbar access commonly used menu functions.
C
Plot Icons
Use
to access the Plot menu.
Use
to toggle between the Monitor Plots and Single Plot
screens.
D
Statistics Area
This area shows the present reading, along with updating
statistics for minimum, maximum, and average of the signals
encountered.
E
Plot Area
The plot area shows the present (or present and previous)
waveform along a selectable time interval.
F
Screen Tabs
The VT for Windows software provides several review and test
screens, accessible through the tab set near the bottom of the
screen. These screens are the Monitor screen, the Single Plot
screen, the Loop Plots screen, and the Full Test screen. In
addition, the Test Settings menu allows access to the Trend
Test, Leak Test, and Stacked Test screens.
G
Status Bar
A status bar (6) appears at the bottom of the screen; this shows
the current status of several user settings, including zeroing
mode, correction mode, and the selected flow port. System
messages such as Zeroing also appear here.
H
Selected File \ System
Messages
This area shows the path to any displayed and stored signal.
I
File Controls and Test
Settings
Panels appear here for File Controls, Trend Test, and Leak
Test functions.