Using the toolbar, Using the main screens, Monitor plots screen – Fluke Biomedical VT Mobile User Manual
Page 74
VT MOBILE
Operators Manual
A-8
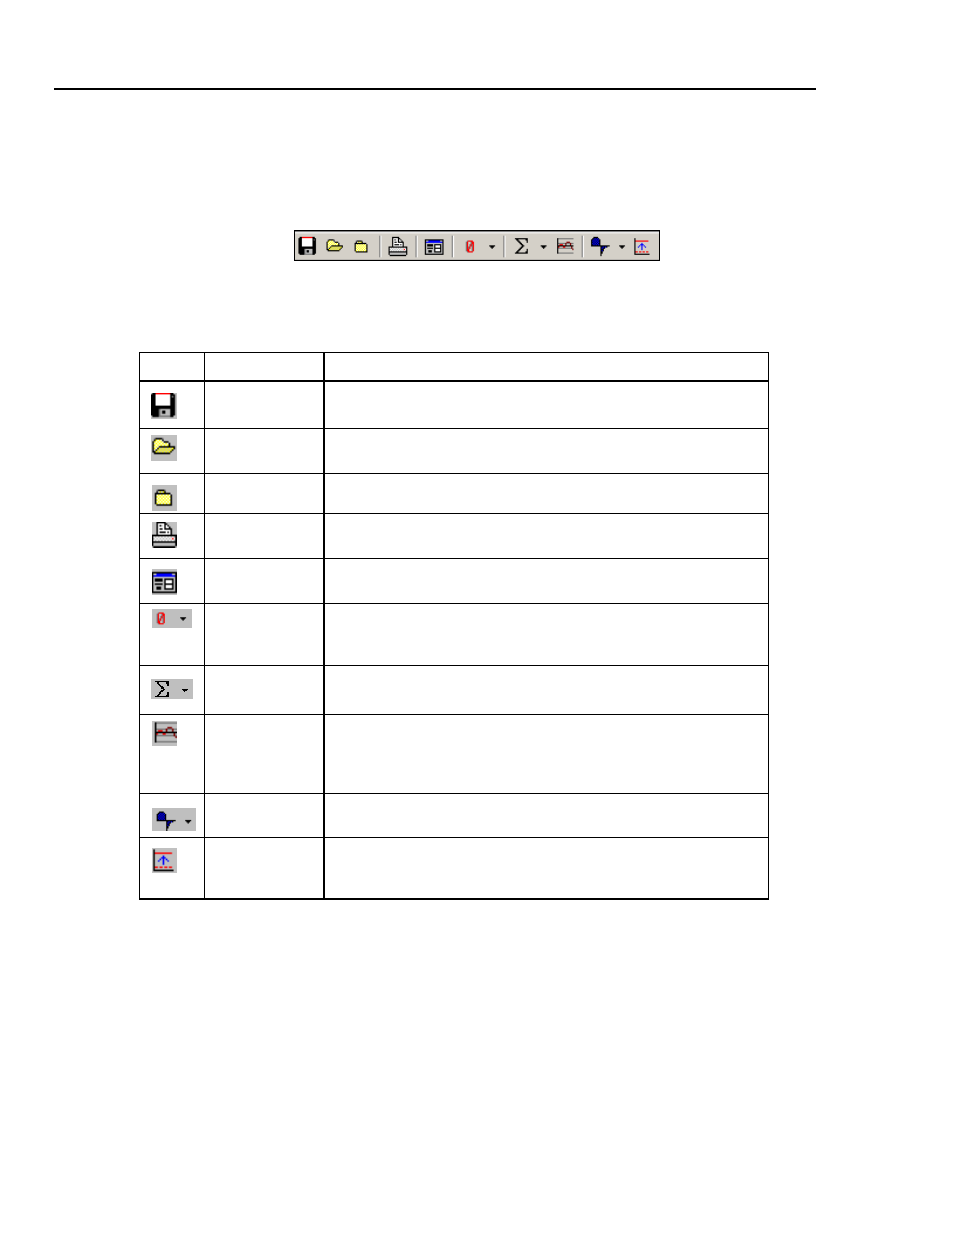
Using the Toolbar
The toolbar (Figure A-10) provides both convenience and speed. It provides a quick and
easy way to call often-used functions. Table A-2 presents descriptions of the buttons and
their functions.
edg56s.bmp
Figure A-10. Toolbar
Table A-2. Toolbar Buttons
Button Name
Description
Save As button
This button calls up the Save As dialog and allows you to begin
saving your data to a file.
Open file button
This button calls the Open dialog that allows you to begin reviewing a
file.
Close file button
This button closes any open data files.
Print button
This button gives you quick access to the print functions. Click this
button to open the Print dialog box.
File controls
button
This button toggles the File Controls window on or off.
Zeroing button
This button forces the Analyzer to zero immediately. For more
information about zeroing choices with the pull-down menu, see the
Zeroing section.
Clear Statistics
button
This button forces the Analyzer to clear either a selected statistic or
all statistics.
Re-scale button
This button forces all the plots to re-scale immediately, rather than
wait for the auto scale to re-scale them. Note that the Re-scale button
only rescales plots that are set to Auto Rescale and does not affect a
plot that is set to manually scale.
(not used)
The Analyzer uses the bi-directional breath detect mode.
Breath Detection
Flow Threshold
This button brings up a dialog box for entering the breath detection
flow threshold. For more information, see the Other Setup Functions
section.
Using the Main Screens
You can access four main screens with VT for Windows. Switch among Monitor Plots,
Loop Plots, and Full Test screens by selecting the appropriate file tab on the bottom of
the screen. Select the Single Plot screen by clicking the Plot icon from the Monitor Plots
screen.
Monitor Plots Screen
The Monitor screen (Figure A-11) allows you to observe three of the signals at the same
time. Configure each plot to display any of the signals (flow, volume, airway pressure,
low pressure, high pressure, oxygen, temperature, or relative humidity). You can set each
plot independently to auto-scaling or to manually re-scaling to your specified range of