Single plot screen – Fluke Biomedical VT Mobile User Manual
Page 75
Advertising
Appendices
VT for Windows
A
A-9
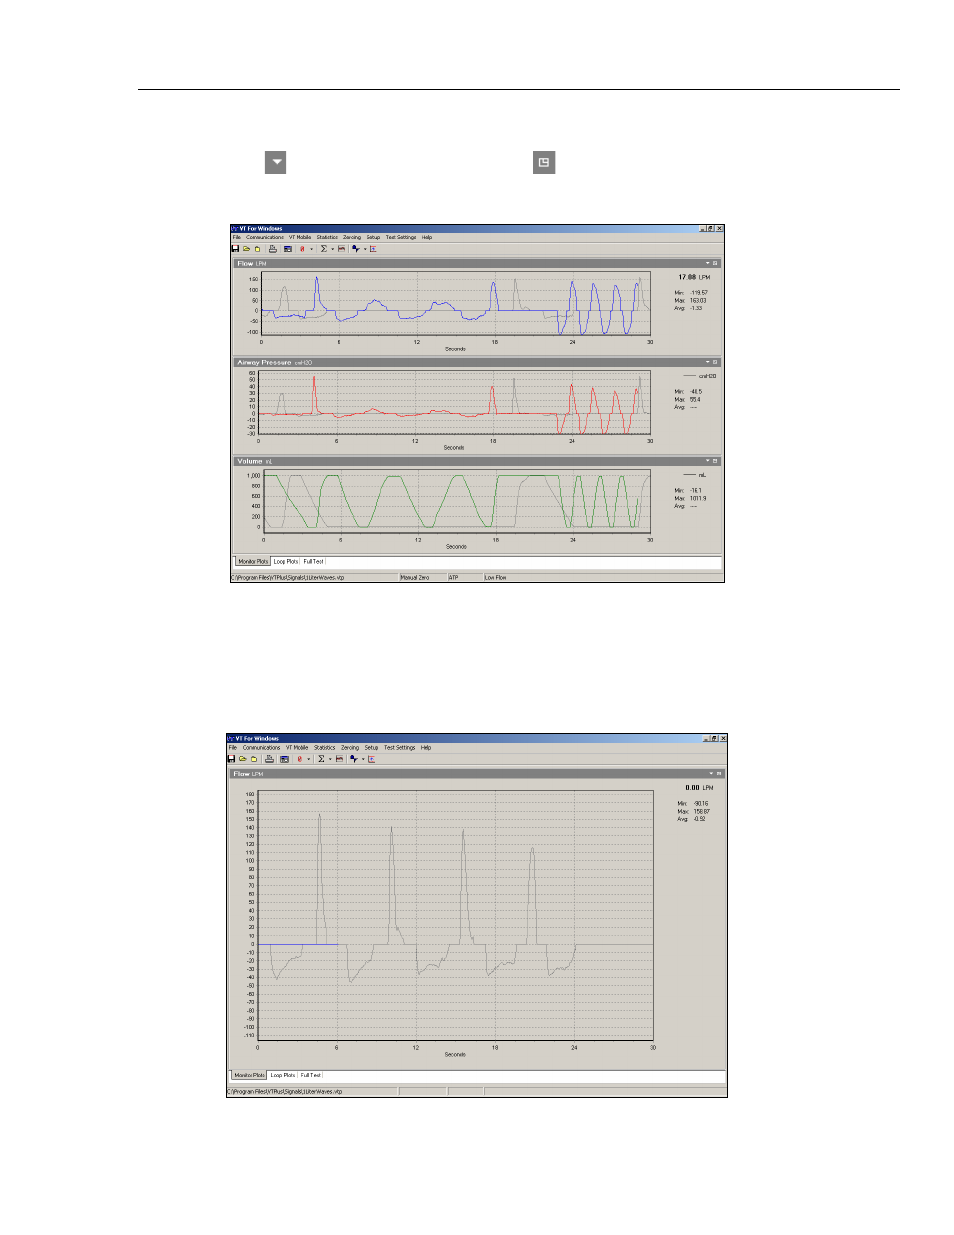
values. The statistics for the selected signals (min, max, average, and current value)
appear on the right side of the screen. In the upper right corner of each plot, you can
select the
icon to access the Plot menu or the
icon to toggle between the Monitor
Plots and Single Plot screens.
edg57s.bmp
Figure A-11. Monitor Screen
Single Plot Screen
Toggle between three-signal and one-signal view by clicking the small screen icon in the
upper right corner of the plot. Figure A-12 shows a Single Plot screen.
edg58s.bmp
Figure A-12. Single Plot Screen
Advertising
See also other documents in the category Fluke Biomedical Equipment:
- 7000DP Impulse Supplement (12 pages)
- 7000DP Impulse Getting Started (36 pages)
- 7000DP Impulse (92 pages)
- 06-526-2200 (26 pages)
- 07-417 (16 pages)
- 07-443 (14 pages)
- 07-451 (8 pages)
- 07-487 (12 pages)
- 07-453 (24 pages)
- 07-555 (8 pages)
- 07-553 (10 pages)
- 07-605-7777 (8 pages)
- 07-444 (46 pages)
- 07-618 (10 pages)
- 07-600 (6 pages)
- 07-591 (8 pages)
- SigmaPace 1000 (154 pages)
- 07-653 (8 pages)
- 07-633 (20 pages)
- 07-649 (14 pages)
- 07-661-7662 (12 pages)
- 07-645 (14 pages)
- 10100AT (80 pages)
- 07-644 (10 pages)
- 18-203 (4 pages)
- 07-621 (12 pages)
- 07-647 (12 pages)
- 18-207 (8 pages)
- 18-216-1000 (10 pages)
- 18-220 (10 pages)
- 18-228 (8 pages)
- 18-223 (18 pages)
- 18-229-1313 (6 pages)
- 18-250 (8 pages)
- 18-252 (6 pages)
- 18-303 (6 pages)
- 35035 (19 pages)
- 6000-528 (18 pages)
- 35080B (70 pages)
- 6000-529 (16 pages)
- 35080M (64 pages)
- 6000-530B (16 pages)
- 57-436 (12 pages)
- 57-440 (12 pages)
- 57-402 (32 pages)