Print, Using the plot menu, Signal selection – Fluke Biomedical VT Mobile User Manual
Page 87
Appendices
VT for Windows
A
A-21
You can print reports from the VT for Windows software to any printer installed on your
computer.
There are two ways to print from VT for Windows. Selecting Print from the File menu or
clicking the Print button on the toolbar brings up the system Print dialog box. This allows
you to select which printer you want to use and adjust settings on that printer. Clicking
OK sends the report to the printer.
The print header that appears at the top of the reports is stored in the Analyzer. It is
loaded into the VT for Windows software every time it connects to an Analyzer unit.
Change the print header using the Printout Header function in the Setup menu.
Using the Plot Menu
Access plot settings by clicking the arrow icon in the upper right corner of the plot.
Figure A-25 shows the icon and the resulting Plot menu.
edg95s.bmp
Figure A-25. Plot Menu
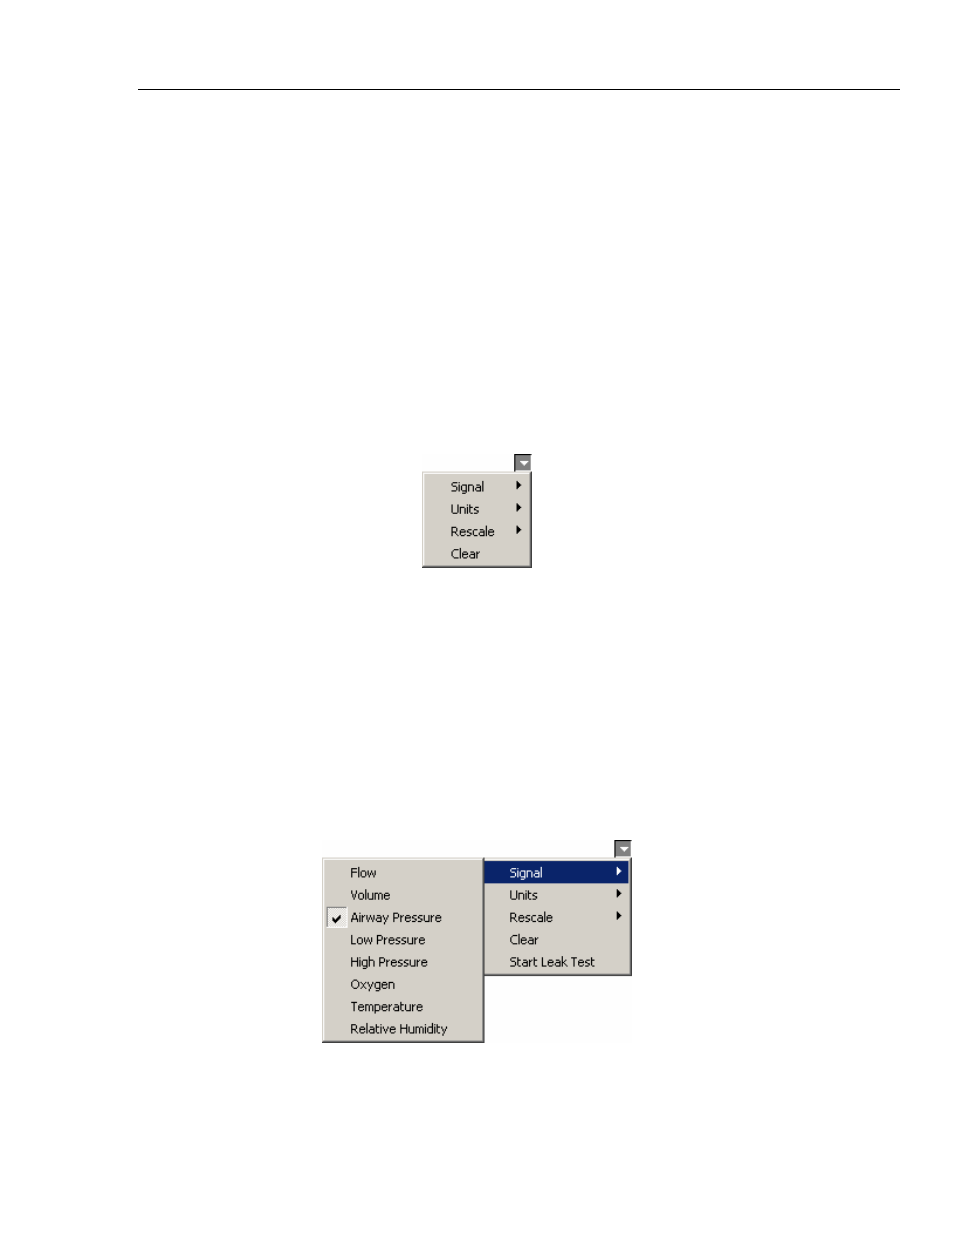
Signal Selection
You can set up the three plots on the Monitor screen and the plot on the Single Plot
screen to display any of the signals: flow, volume, airway pressure, low pressure, high
pressure, oxygen, temperature, or relative humidity.
To change the displayed signal on a plot, select the plot's name from the Plot menu and
select the name of the signal you want displayed. See Figure A-26. The desired signal's
name appears on the title of the plot and above the statistics to the right of the plot. The
statistics and the plot now reflect the new signal and appear in the selected units for that
signal.
edg92s.bmp
Figure A-26. Selecting a Signal