4 show rmon history, Example, Syntax – PLANET WGSD-1022 User Manual
Page 247: Default configuration, Command mode
Example
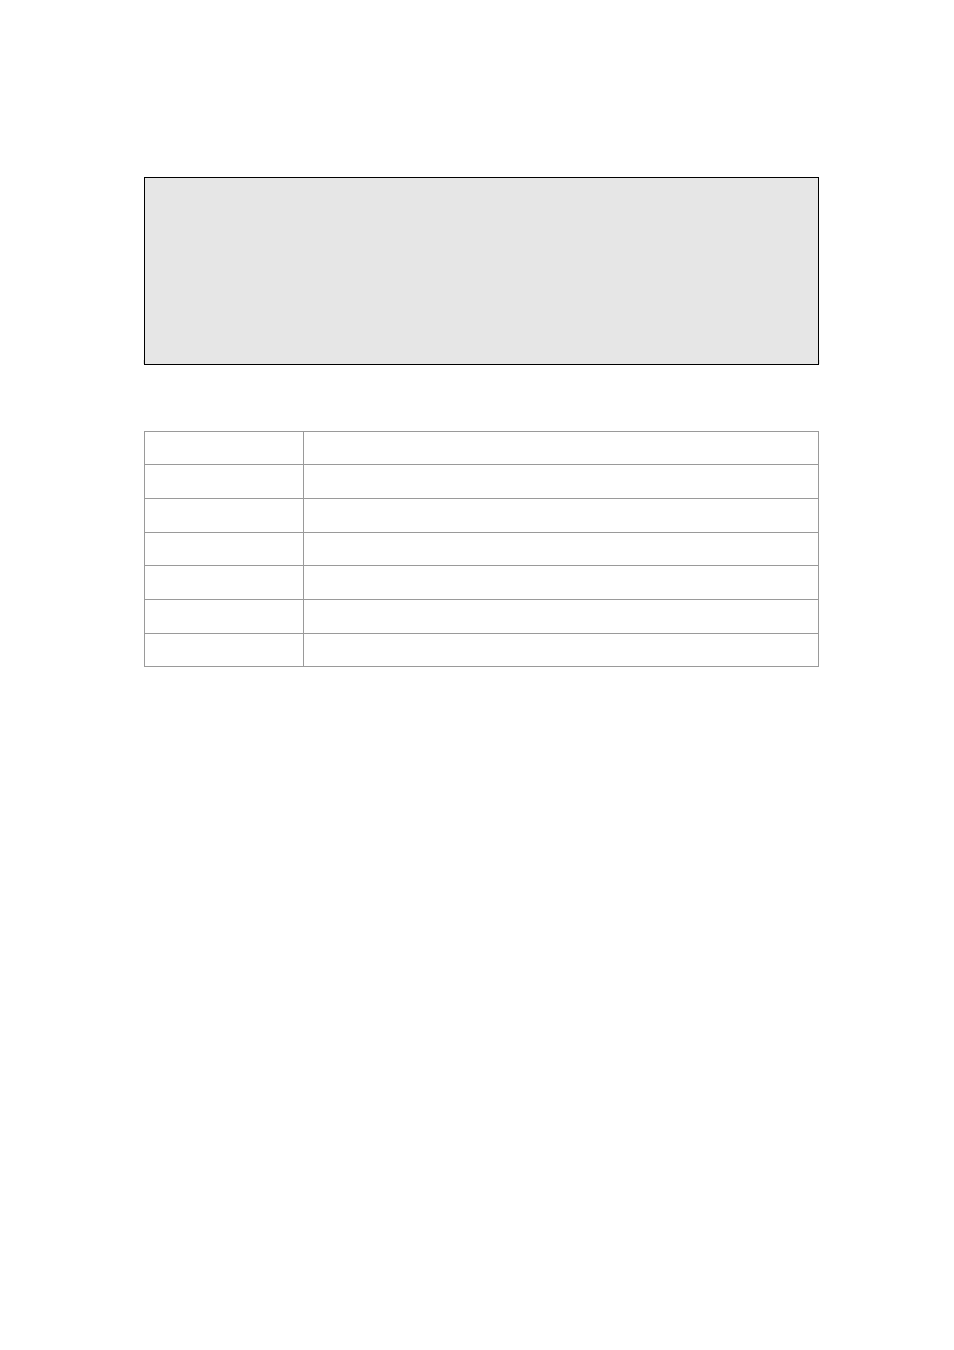
The following example displays all RMON group statistics.
Console# show rmon collection history
Index Interface Interval Requested Granted Owner
Samples Sample
------- ---------- ----------- --------------- ------------ ---------
1 1 1000 50 50 CLI
The following table describes the significant fields shown in the display:
Field
Description
Index
An index that uniquely identifies the entry.
Interface
The sampled Ethernet interface
Interval
The interval in seconds between samples.
Requested Samples
The requested number of samples to be saved.
Granted Samples
The granted number of samples to be saved.
Owner
The entity that configured this entry.
5.19.4 show rmon history
The show rmon history user EXEC command displays RMON Ethernet Statistics history.
Syntax
show rmon history index {throughput | errors | other} [period seconds]
index — The requested set of samples. (Range: 1 - 65535)
throughput — Displays throughput counters.
errors — Displays error counters.
other — Displays drop and collision counters.
period seconds — Specifies the requested period time to display. (Range: 1 - 4294967295)
Default Configuration
This command has no default configuration.
Command Mode
User EXEC mode