Super Systems 9205 Series User Manual
Page 36
Series 9205 Operations Manual Rev A
35
As – deal with the trend chart files themselves, not the individual trend lines.
Open will allow the user to select a trend chart file to open up to edit.
New will create a new trend chart file to begin adding trend lines to.
Delete will delete a specified trend chart file.
Save will save all changes to the current trend chart file that have been made.
Save As will allow the user to save the current trend chart file as a new file with a different name.
Once a new trench chart file has been created, or one has been opened, trend lines can be added, modified,
or deleted. Add will add a new trend line to the file. Edit will allow the user to edit the information for a
specific trend line. Delete Line will delete the specified line from the chart file.
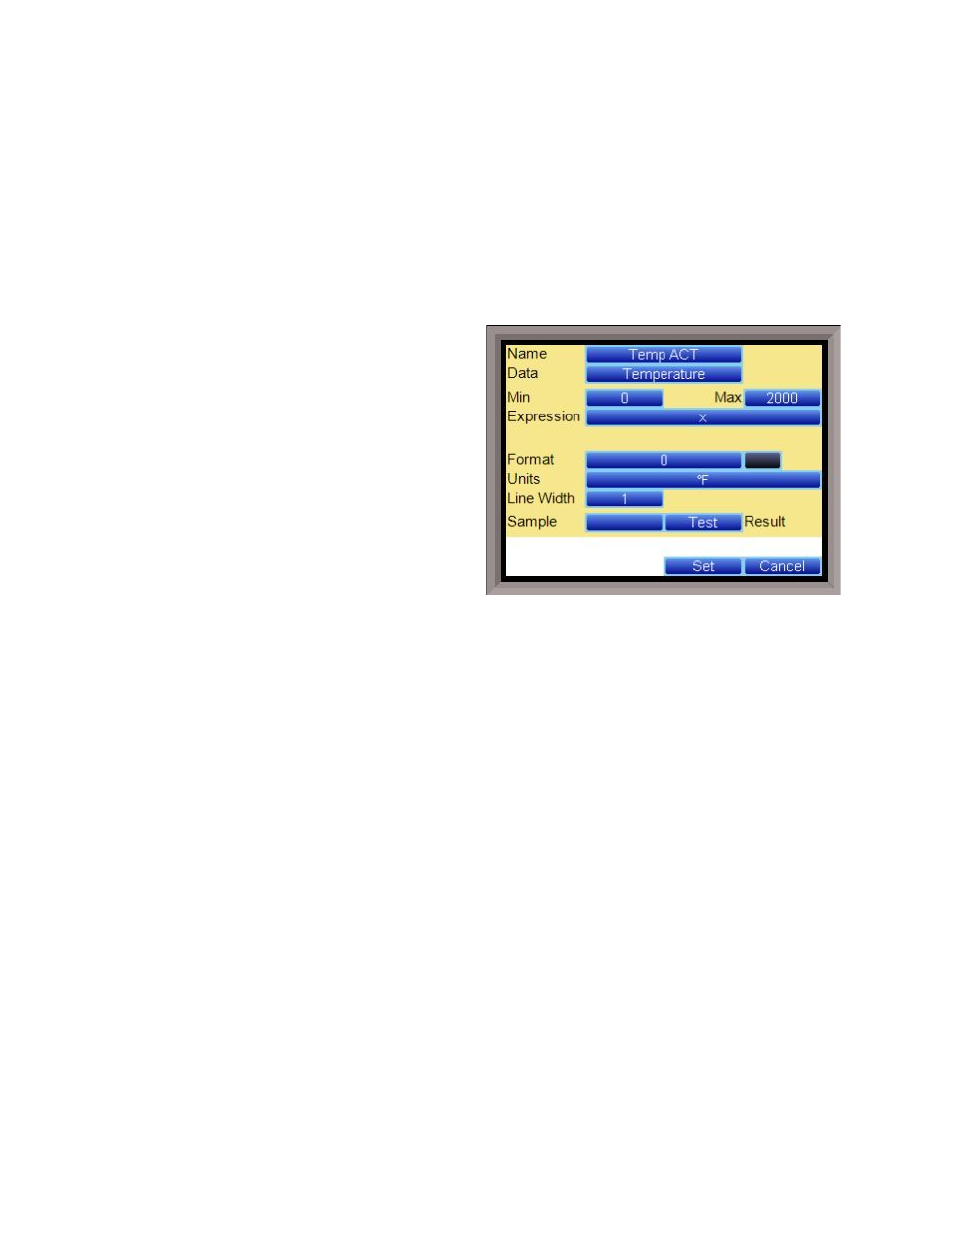
Adding or editing a trend line will involve the following parameters:
Name – the name of the input, for example “Temp
ACT” which would be the actual temperature of the
input. It is a good idea to shorten the names so that
they still make sense, but do not take up as much
space.
Data – This will determine where the data is coming
from. The user can click on the box to select from
the list of data logged points in the 9205. Some of
the points have a name, such as “Temperature” or
“Temperature SP”, but others will just show the
register in the 9205 that has been logged. Note that
certain parameters are already setup and logged.
For anything needed beyond this, you will need to
contact SSi at (513) 772-0060 to get the register
information. This register will need to be added to
the Datalogging Setup in the Configuration menu.
Min – the minimum displayed scale value on a chart.
Max – the maximum displayed scale value on a chart.
Expression – every input requires an expression to be calculated and displayed correctly. This is because
the registers in the 9205 hold only integer values, so any value that requires a decimal point needs to be set
up properly for the display. For example an expression for temperature would be x (1750 = 1750). For a
value such as carbon or millivolts, the expression would be x * 0.01 (150 = 1.50) or x * 0.1 (805 = 80.5).
Format – the value displayed on the chart display of the operator interface. A short custom description can
be added here. For example, to display one (1) decimal point, enter a value of “#0.0”. For carbon values,
enter a value of “#0.00” for 2 decimals. This would display a value like “0.81”. Entering “#.00” would
display a value of “.81”. #0 or 0 will display integer values.
Color – The box next to the format box will allow the user to apply a color to the trend line to differentiate it
from other trend lines on the chart.
Units – The type of units used for the trend.
Line Width – a numeric value for the thickness of the trend line. A 1 is a thin line; A higher value = thicker
line width.
Sample – a number is entered here to test the expression and verify that formatting is correct.
Test – Press the test button to calculate the expression with the value entered in the sample parameter.
For example with an expression of x*.1 and a value of 250 entered in the sample parameter will display a
25.0.
The Set button will save the values entered. The Cancel button will cancel the information and make no
changes.
The OK button will close the screen and prompt the user to save any changes if changes have been made.
The Cancel button will close the screen and return to the menu screen.