5 profiles – Casella CEL CEL-281 User Manual
Page 107
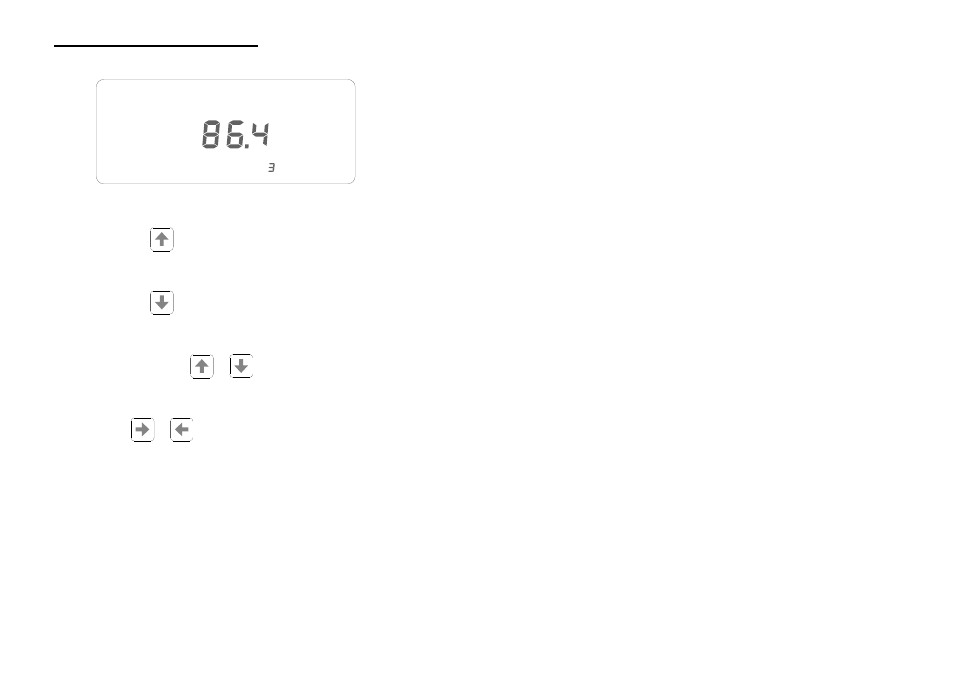
4.
Press the
key to display the relevant cumulative percent
values.
5.
Press the
key to display the relevant probability percent
values.
6.
Then press either
or
keys to select the other para-
meter (% or dB) in the current histogram for display.
7.
Press
or
keys to select respectively, the next higher
or lower distribution value or dB level cell in the currently dis-
played histogram.
5.5
Profiles
The CEL-281 stores up to fourteen hours of noise history data in the
form of profiles with noise levels and times accurately recorded. Pro-
vided the instrument has already stored some data, is not in calibration
delay mode or calibration mode, and the display is switched ON, it can
be used to display the stored profile information as follows.
ON
LAVG
1
SEC
dBA
Q=
910038
Figure 18: Typical display showing 1 second L
AVG
level in dB(A)
Page 98 - CEL-281 Operator's Handbook
Obtaining Required Results_