Introduction – Casella CEL CEL-281 User Manual
Page 32
Advertising
10%
20%
30%
40%
50%
60%
70%
80%
90%
100%
10%
5%
Probability%
Cumulative%
L
90
L
50
L
10
dB
L
L
MAX
MIN
dB
910006
100
65%
70
80
90
110
120
130
140
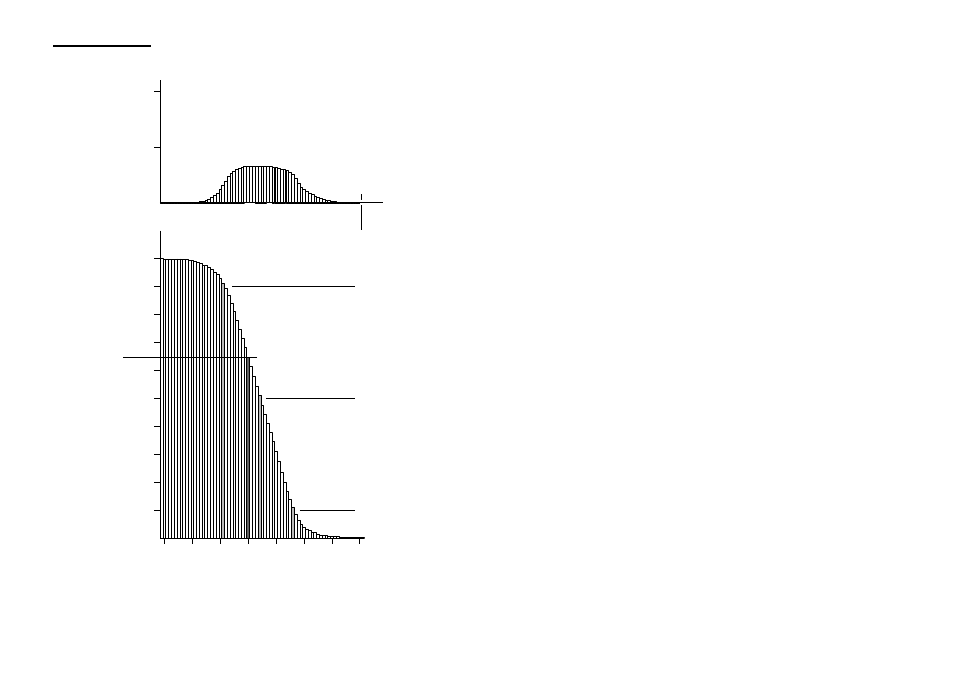
Figure 3 Comparison of probability% and cumulative% histograms
(Note the different vertical scales)
Page 24 - CEL-281 Operator's Handbook
Introduction_
Advertising