H3C Technologies H3C WX6000 Series Access Controllers User Manual
Page 164
20-6
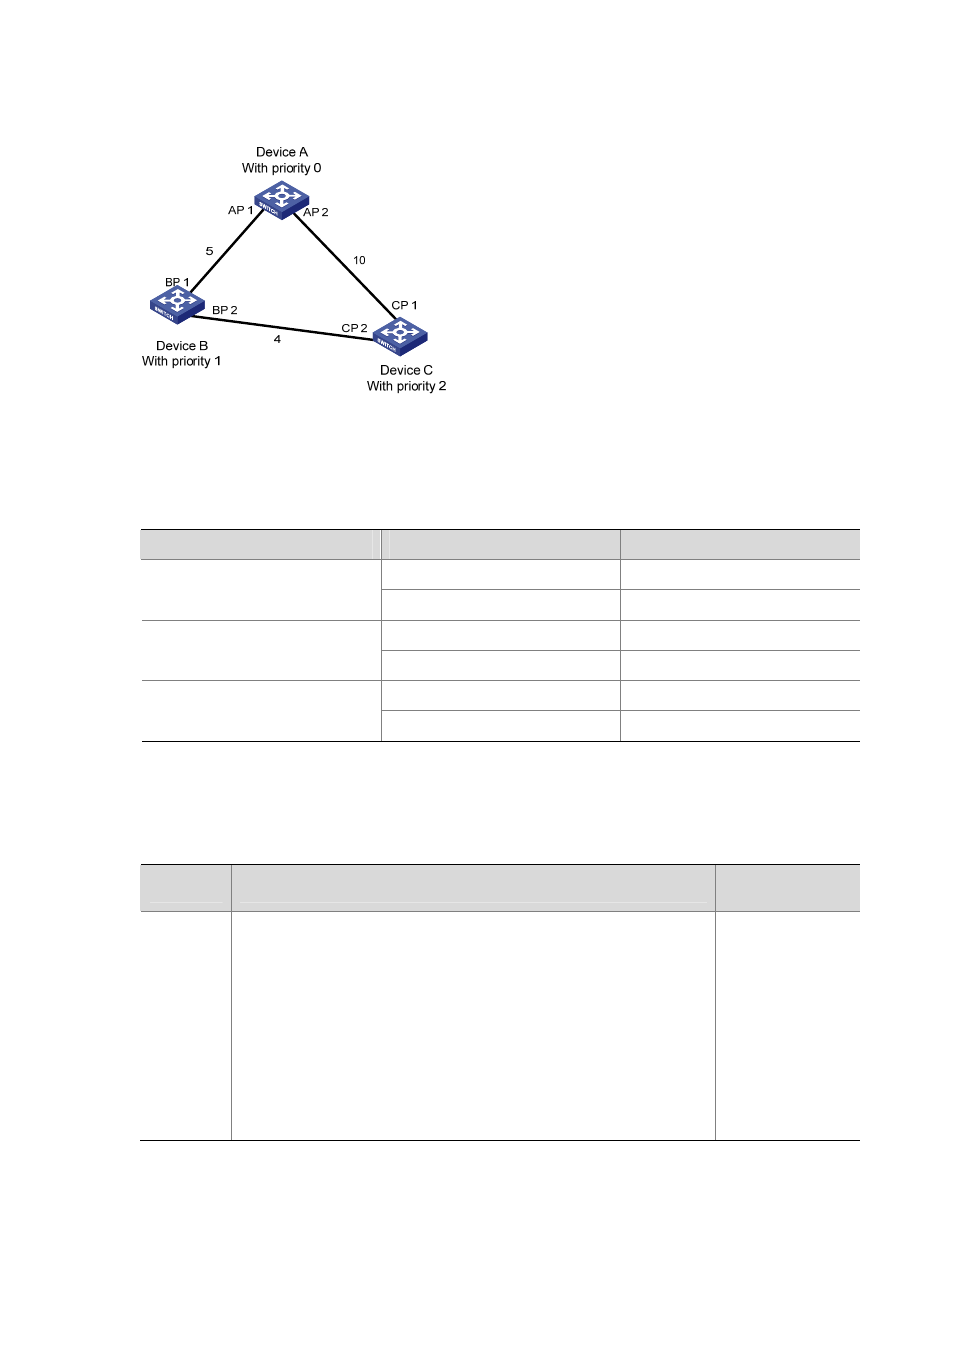
Figure 20-2
Network diagram for the STP algorithm
z
Initial state of each device
The following table shows the initial state of each device.
Table 20-4
Initial state of each device
Device
Port name
BPDU of port
AP1
{0, 0, 0, AP1}
Device A
AP2
{0, 0, 0, AP2}
BP1
{1, 0, 1, BP1}
Device B
BP2
{1, 0, 1, BP2}
CP1
{2, 0, 2, CP1}
Device C
CP2
{2, 0, 2, CP2}
z
Comparison process and result on each device
The following table shows the comparison process and result on each device.
Table 20-5
Comparison process and result on each device
Device
Comparison process
BPDU of port after
comparison
Device A
z
Port AP1 receives the configuration BPDU of Device B {1, 0, 1, BP1}.
Device A finds that the configuration BPDU of the local port {0, 0, 0,
AP1} is superior to the configuration received message, and discards
the received configuration BPDU.
z
Port AP2 receives the configuration BPDU of Device C {2, 0, 2, CP1}.
Device A finds that the BPDU of the local port {0, 0, 0, AP2} is superior
to the received configuration BPDU, and discards the received
configuration BPDU.
z
Device A finds that both the root bridge and designated bridge in the
configuration BPDUs of all its ports are Device A itself, so it assumes
itself to be the root bridge. In this case, it does not make any change to
the configuration BPDU of each port, and starts sending out
configuration BPDUs periodically.
AP1: {0, 0, 0, AP1}
AP2: {0, 0, 0, AP2}