6 tms gui tabs description, 1 monitoring tab, 1 presentation – Doremi TMS User Manual
Page 40
6 TMS GUI Tabs Description
6.1 Monitoring Tab
•
To enter the Monitoring tab, click on Monitoring on the top of the GUI.
•
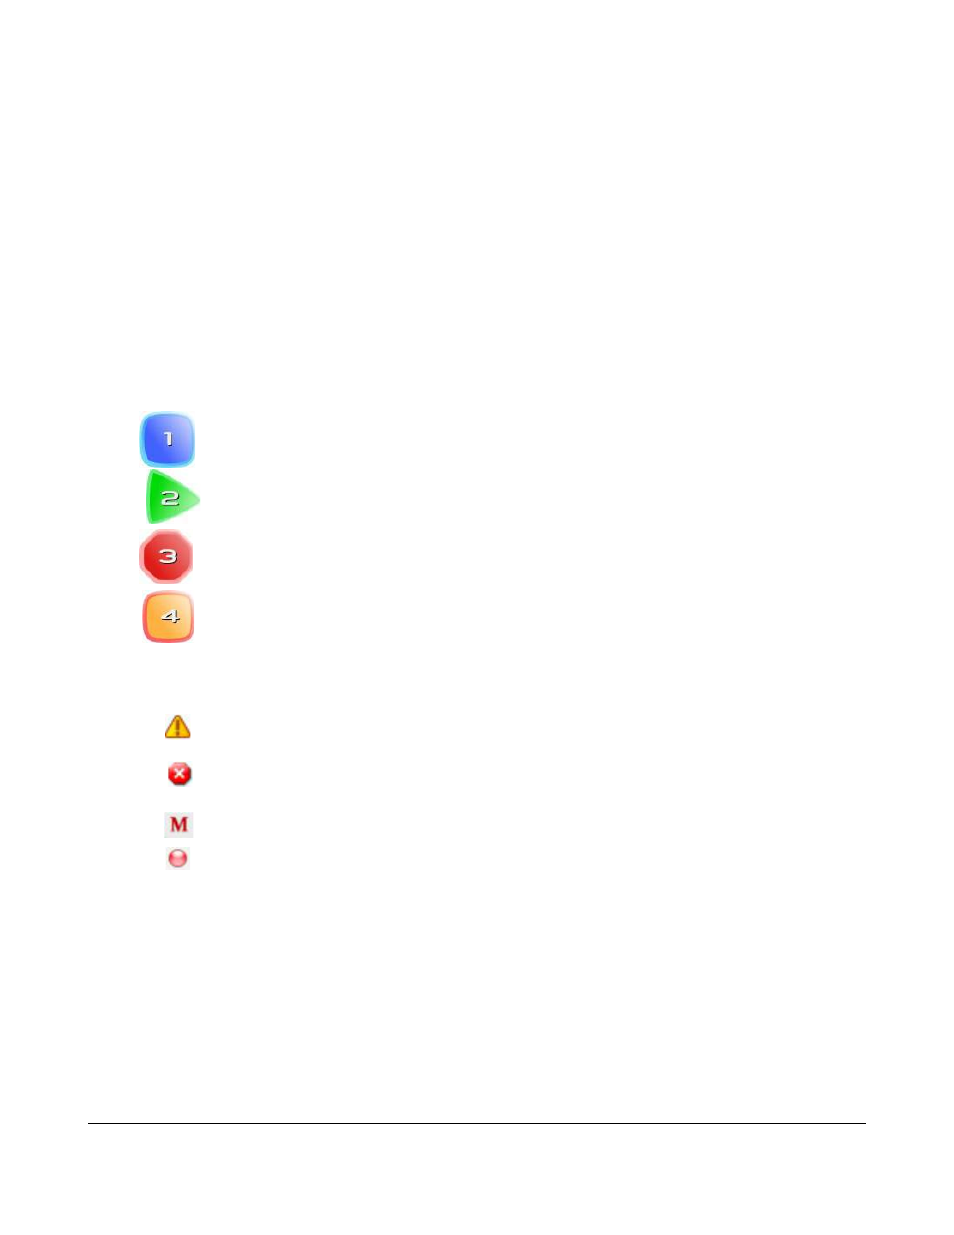
The Monitoring window is composed of two different parts (Figure 36):
1. The top part lists all the screens added to the TMS together with their states: offline,
online, and playing.
2. The bottom part displays information about the selected screens.
6.1.1 Presentation
Screens are listed vertically under the screen column header. Each screen is identified with an icon
displaying the screen number inside it. The icon's color and shape reflects the current status of the
SMS. Below are the different icons used:
•
:Blue square indicates online and idle status.
•
:Green triangle indicates online and playing content.
•
:Red hexagon indicates offline.
•
:Orange square indicates that the media block is disconnected.
•
A smaller icon can appear next to the screen number when the available free space drops
below a certain threshold.
◦
:A warning icon in yellow indicates that the configured warning threshold (11% - 20%)
for the remaining free space was reached.
◦
:A critical icon in red indicates that the configured critical threshold (10% or less) for the
remaining free space was reached.
◦
: Playback is configured as Manual Playback.
◦
: Connection error between TMS and server.
TMS.OM.000177.DRM
Page 40 of 106 Version 1.4
Doremi Labs