Traffic meter statistics screen, Traffic meter statistics screen -47 – Verilink WANsuite 5230 (34-00304.F) Product Manual User Manual
Page 163
V T 1 0 0 I n t e r f a c e
4-47
Filter By IP Port
Enables or disables filtering of the IP traffic by the IP port specified in the IP
Port field.
Tx Alarm Threshold
Specifies the threshold in bits per second for the Transmit Alarm on this rule.
Tx Alarm
Shows the current Transmit Alarm status.
Traffic Meter Statistics Screen
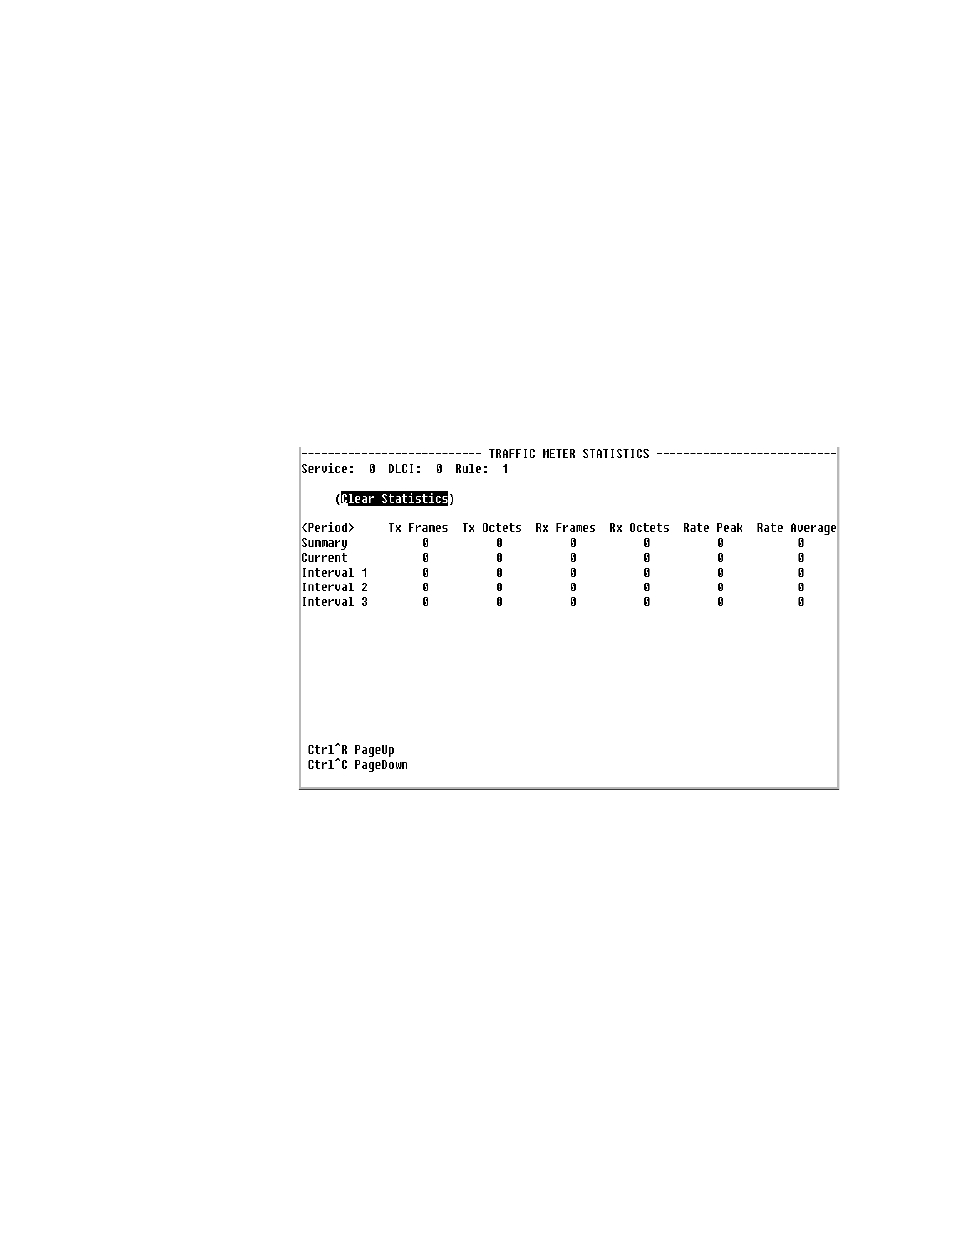
The Traffic Meter Statistics screen, which can be accessed from the bottom of
the Rule Config screen, displays the number of frames and octets sent over a
DLCI that have been counted in accordance with the Service Aware “rule”
that has been established for a Service. As such, it is frame relay specific (i.e.,
DLCIs only occur in frame relay links). In addition, this screen provides data
rate performance information for the period of time you have specified in the
Period Index field (see below).
Figure 4.39
Traffic Meter Statistics Screen
The Traffic Meter Statistics screen reports on the following parameters:
•
Tx Frames
•
Tx Octets
•
Rx Frames
•
Rx Octets
•
Rate Peak – the peak data rate for the viewed period (see below)
•
Rate Average – the average data rate for the viewed period (see below)
The “Period” refers to the period of time for which the Traffic Meter statistics
are reported as listed below.
Summary
Represents the past 24 hours; reports the additive number of frames/octets, the
highest peak encountered for 24 hours, and the average for 24 hours.