Chart view – Super Systems SuperDATA User Manual
Page 144
Super Systems Inc
Page 144 of 172
Super Data Operations Manual
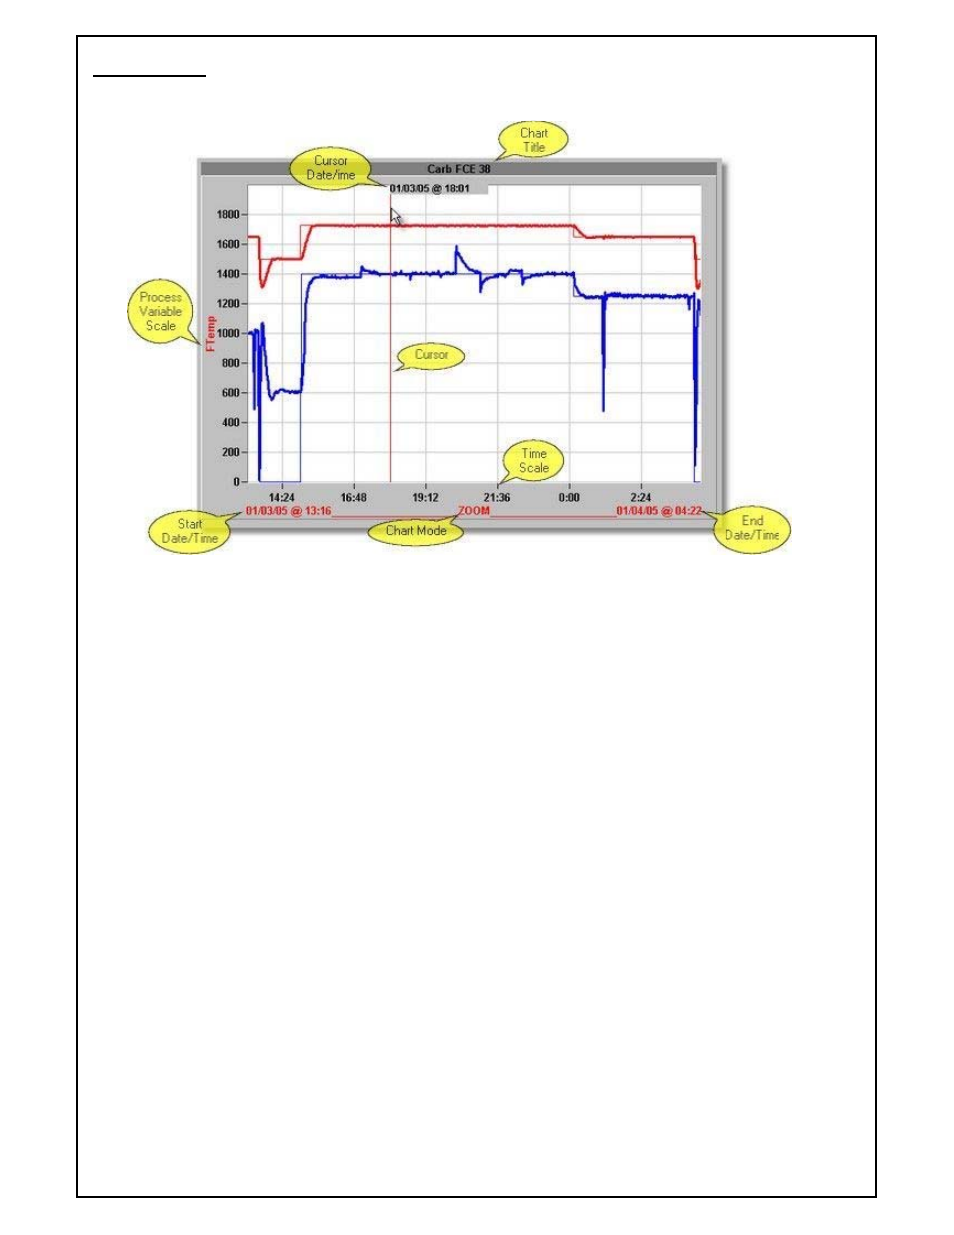
Chart View
Trend Chart View area
Chart Title – Appears at the top of the Chart.
Cursor – Red vertical line through the chart, date and time displayed with the cursor. The cursor may be dragged
with the mouse (left click on the cursor and drag with mouse). You can also right click the mouse and the cursor will
jump to the clicked position.
Process Scale – A single scale appears on the left hand of the chart. Only one process scale is displayed at a time,
the scale to be displayed can be selected by clicking the radial button next to the process variable in the cursor data
area.
Time Scale – The time scale is from right to left at the bottom of the chart view.
Time Range – The time range is displayed at the bottom of the view, this line will also indicate the chart mode
(NORMAL, HISTORICAL LOAD, PAN, ZOOM etc).