Super Systems SuperDATA User Manual
Page 159
Super Systems Inc
Page 159 of 172
Super Data Operations Manual
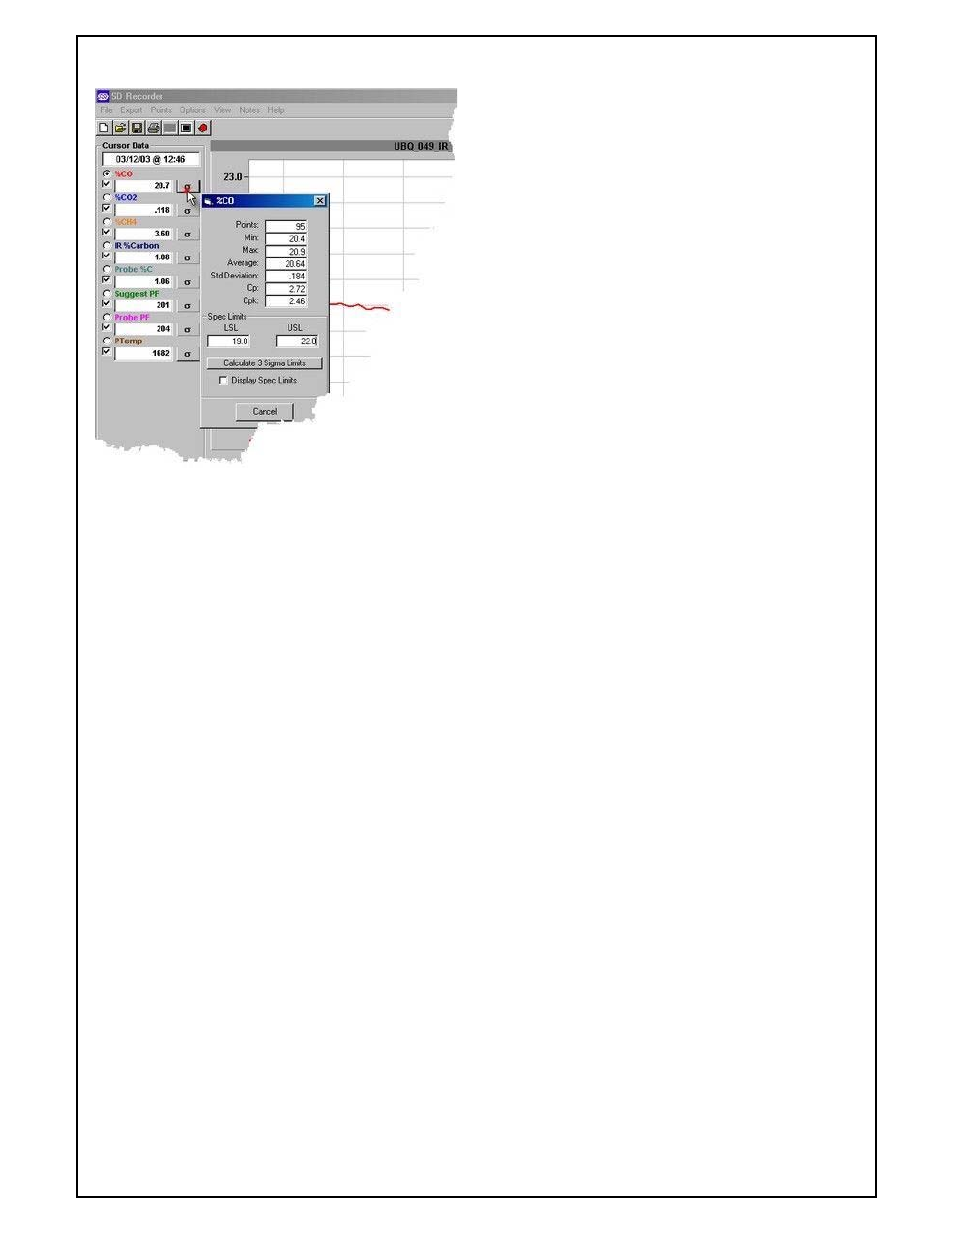
To view a pen's statistics, click on the Statistics Icon in
the cursor data area for the associated pen.
The statistics dialog displays:
•Number of Points (one point per minute) The number of
points is the number of minutes in the current chart
view.
•Minimum value
•Maximum value
•Average value
•Standard deviation
•Cp
•Cpk
•Spec Limits used for calculating Cp and Cpk (When the
Statistics dialog is opened and no Spec Limits have
been set, default spec limits are calculated such that
both Cp and Cpk will have values of at least 1.0. Spec
Limits may be modified in the dialog. When modified,
new values for Cp and Cpk will be calculated.
•Calculate 3 Sigma Limits - click this to generate Spec
Limits that will provide Cp and Cpk of >= 1.0.
•Display Spec Limits (checkbox) - when checked, the
spec Limits will display on the chart when the point's
"Scale Select button is on.
•Note: Summary statistics are of most use when the
process variable is in a steady or controlled state (e.g.
statistics for a temperature would be of little value
when the process is ramping up to temperature). For
this reason, it is best to zoom in on an area where the
process variable in question is relatively constant
before looking at the statistics