Chart control area – Super Systems SuperDATA User Manual
Page 146
Super Systems Inc
Page 146 of 172
Super Data Operations Manual
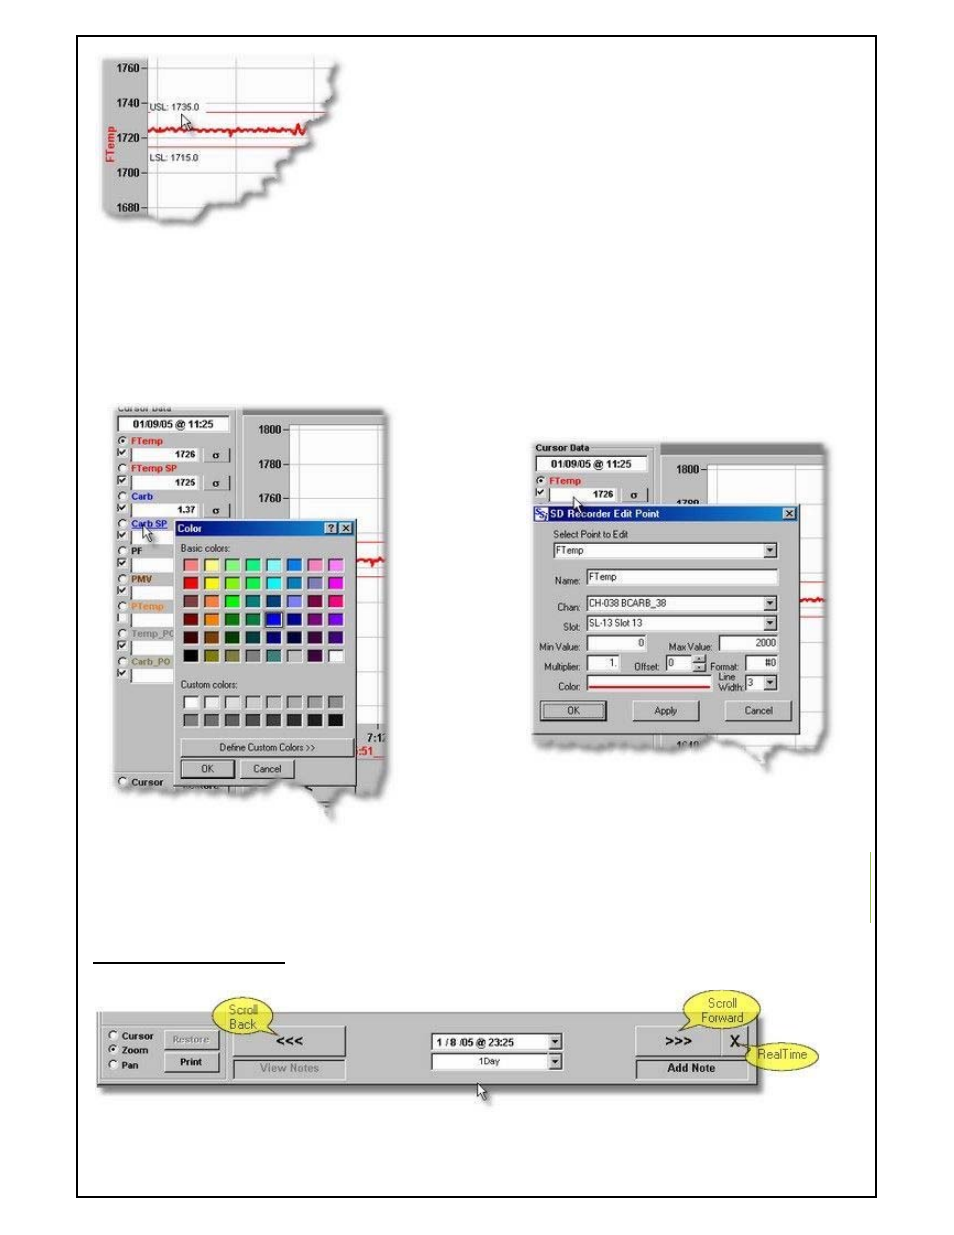
Summary Statistics Button – This button will open a window to display summary statistics for the process variable.
The statistics are for the time displayed in the current view. The statistics window shows the following data: number
of points, Minimum value, Maximum value, average value, standard deviation, Cp and Cpk. Cp and Cpk are based on
the Spec Limits entered for LSL (Lower Spec Limit) and USL (Upper Spec Limit). When this display opens, default
Spec Limits are calculated to result in both Cp and Cpk values of at least 1. After opening the display, you may
change the LSL and USL as required. Changes will result in re-calculating both Cp and Cpk. Spec Limits are
displayed on the Chart for the variable that is the active scale variable (selected by the scale selector).
Pen Color – Right clicking on the Process Variable
name will allow you the change the pen color for
that variable.
Process Variable Editing – Left clicking on a Process Variable
data value will allow you to edit the associated pens definition.
See editing points.
Chart Control Area
Scroll Buttons – The left and right scroll buttons scroll the chart view backwards or forwards by one half the display
width. Using these buttons refreshes the data and will cancel any Zoom or Pan in effect.