N in, Figure 13-2 – H3C Technologies H3C S7500E Series Switches User Manual
Page 158
Advertising
13-6
Figure 13-2
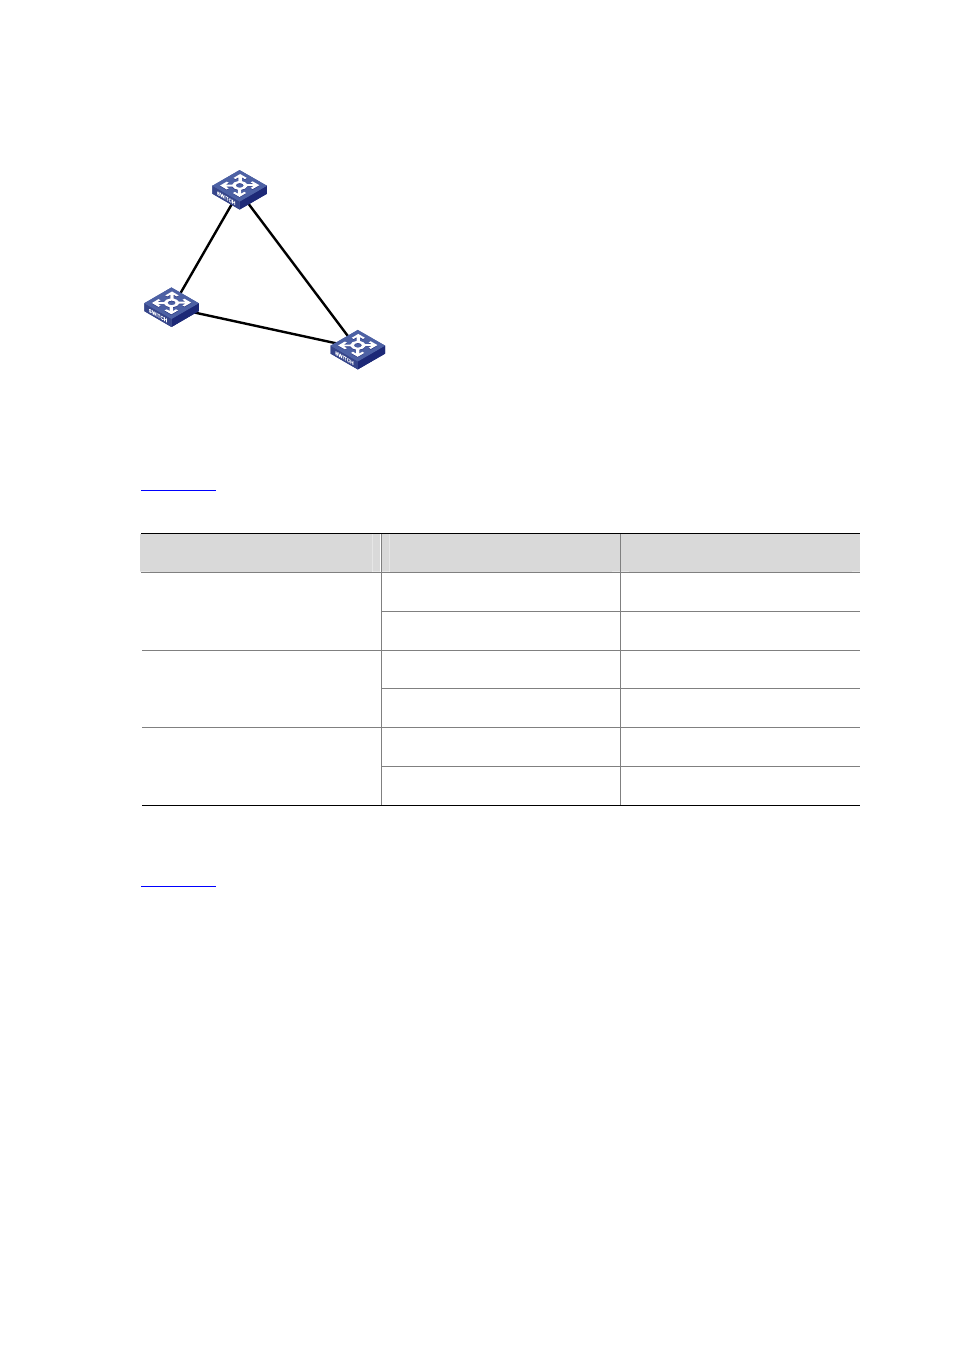
Network diagram for the STP algorithm
AP1
AP2
Device A
With priority 0
Device B
With priority 1
Device C
With priority 2
BP1
BP2
CP1
CP2
5
10
4
Initial state of each device
shows the initial state of each device.
Table 13-4
Initial state of each device
Device
Port name
BPDU of port
AP1
{0, 0, 0, AP1}
Device A
AP2
{0, 0, 0, AP2}
BP1
{1, 0, 1, BP1}
Device B
BP2
{1, 0, 1, BP2}
CP1
{2, 0, 2, CP1}
Device C
CP2
{2, 0, 2, CP2}
Comparison process and result on each device
shows the comparison process and result on each device.
Advertising
This manual is related to the following products: