Traffic meter statistics screen, Traffic meter statistics screen -35 – Verilink WANsuite 6x30 (34-00315.B) Product Manual User Manual
Page 133
V T 1 0 0 I n t e r f a c e
4-35
T x A larm T h resh old
Specifies the threshold in bits per second for the Transmit Alarm on this rule.
T x A la rm
Displays the current Transmit Alarm status.
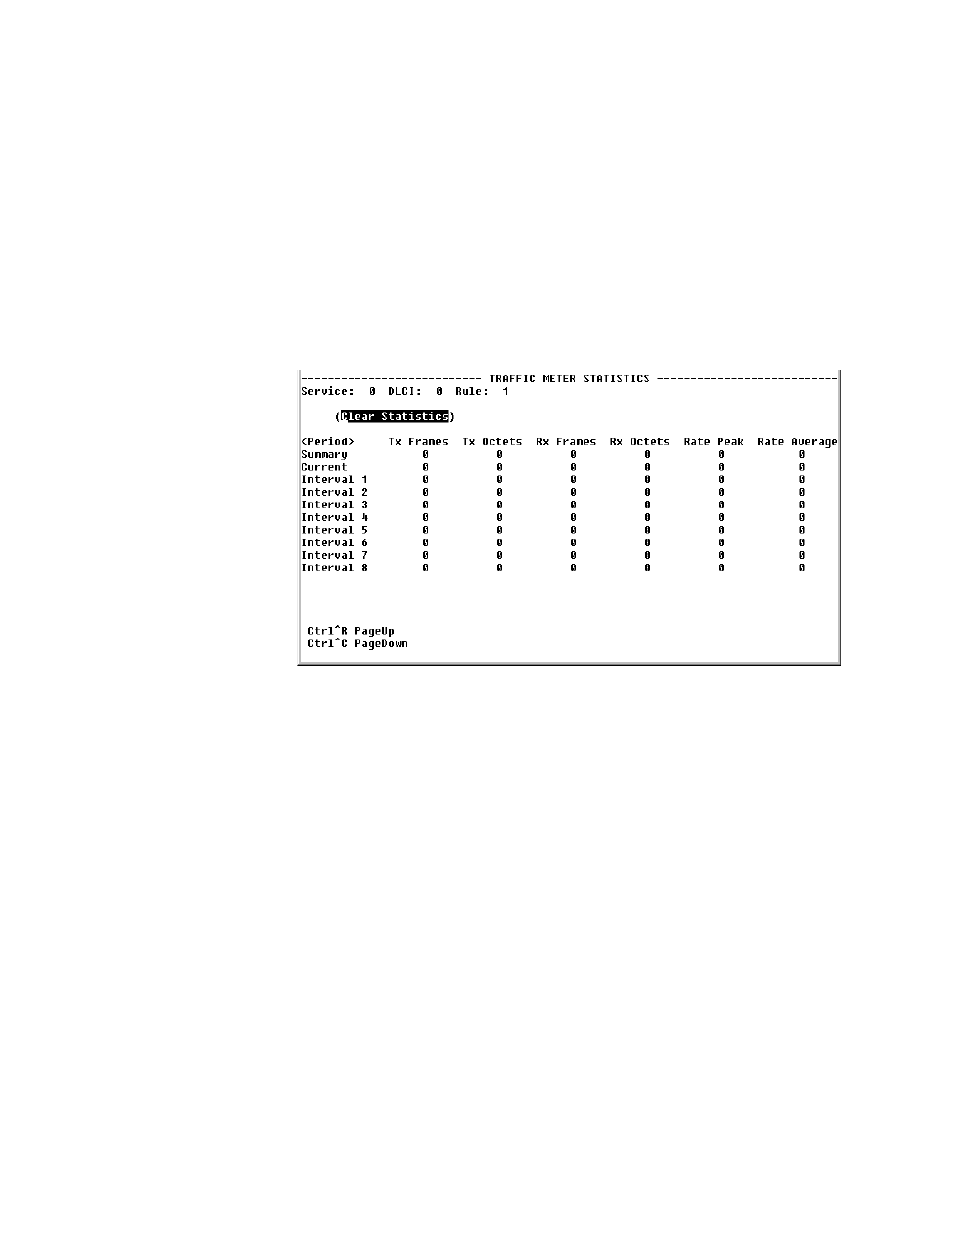
Traffic Meter Statistics Screen
The Traffic Meter Statistics screen displays the number of frames and octets
sent over a VPI/VCI that have been counted in accordance with the Service
Aware “rule” that has been established for a Service. As such, it is
ATM
specific (i.e., VPIs/VCIs only occur in
ATM
links). In addition, this screen
provides data rate performance information for the period of time specified in
the <Period> field (see below).
Figure 4.31
Traffic Meter Statistics Screen
The Traffic Meter Statistics screen reports on the following parameters:
•
Tx Frames
•
Tx Octets
•
Rx Frames
•
Rx Octets
•
Rate Peak – the peak data rate for the viewed period (see below)
•
Rate Average – the average data rate for the viewed period (see below)
The “Period” refers to the period of time for which the Traffic Meter statistics
are reported as listed below.
S u m m a ry
Represents the past 24 hours; reports the additive number of frames/octets, the
highest peak encountered for 24 hours, and the average for 24 hours.
C u rren t
Reports on the current 15-minute interval.
In terva l 1,
In terv al 2,...,
In terv al 96
Reports on Intervals 1-96, which correspond to the periods completed 15
minutes ago, 30 minutes ago,..., 24 hours ago.