Traffic meter statistics screen, Traffic meter statistics screen -38 – Verilink WANsuite 6x30 (34-00315.B) Product Manual User Manual
Page 66
3-38
W A N s u i t e 6 x 3 0
T x A larm T h resh old
Specifies the threshold (in bps) for the Transmit Alarm on this rule.
T x A la rm
Displays the current status of the Transmit Alarm.
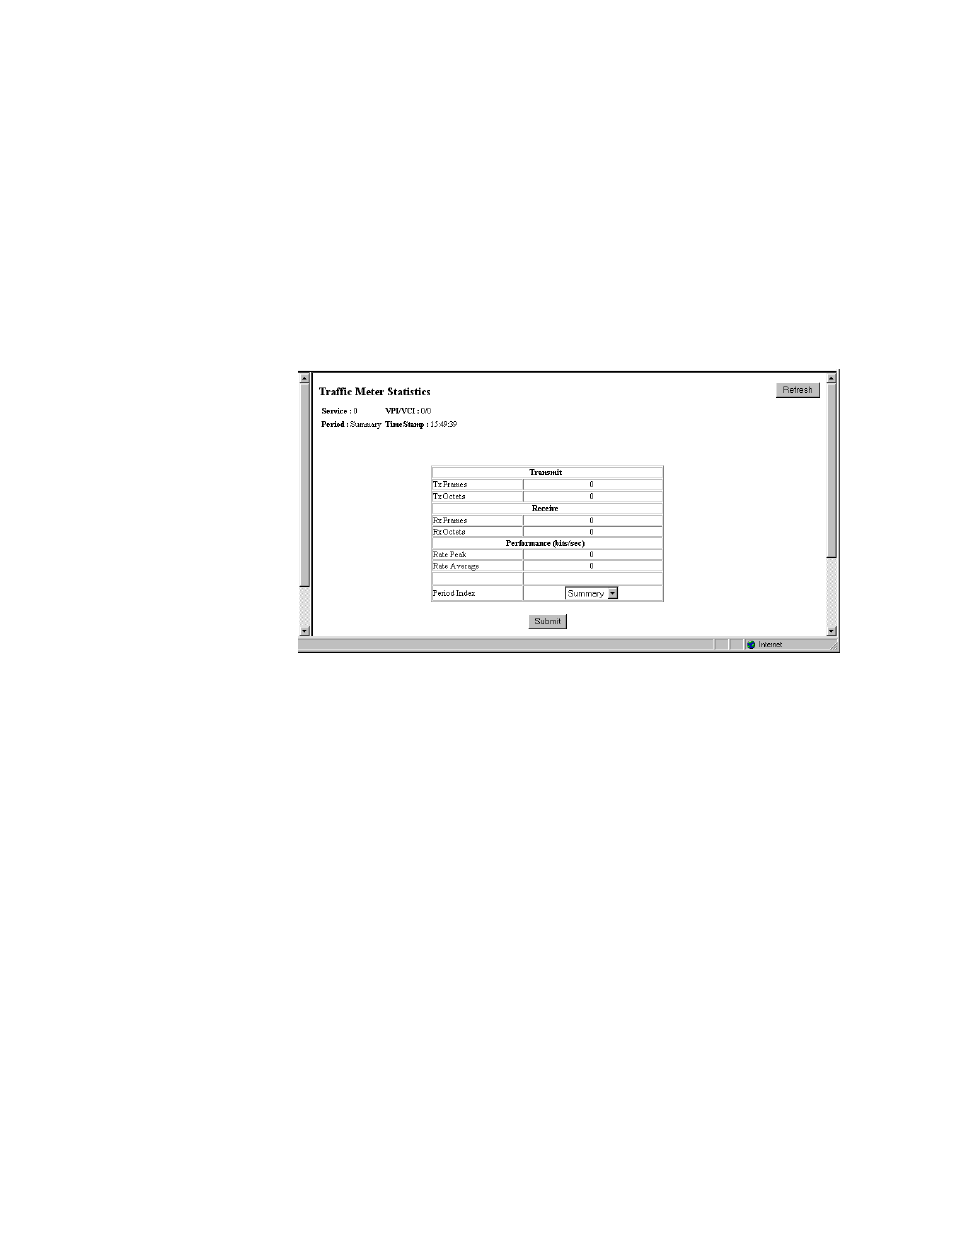
Traffic Meter Statistics Screen
The Traffic Meter Statistics screen displays the number of frames and octets
sent over a VPI/VCI that have been counted in accordance with the Service
Aware “rule” that has been established for a Service. As such, it is
ATM
specific (i.e., VPI/VCIs only occur in
ATM
links). In addition, this screen
provides data rate performance information for the period of time specified in
the Period Index field (see below).
Figure 3.35
Traffic Meter Statistics Screen
The Traffic Meter Statistics screen reports on the following parameters:
•
Tx Frames
•
Tx Octets
•
Rx Frames
•
Rx Octets
•
Rate Peak – the peak data rate for the viewed period (see below)
•
Rate Average – the average data rate for the viewed period (see below)
The Period Index field is used to define the period of time for which the
Traffic Meter statistics will be reported. It represents the 24-hour, 15-minute
buckets index. Selecting a period and then clicking the “Submit” button will
display the traffic meter statistics for that period. The user-selectable options
are listed below.
S u m m a ry
Represents the past 24 hours; reports the additive number of frames/octets, the
highest peak encountered for 24 hours, and the average for 24 hours.
C u rren t
Reports on the current 15-minute interval.