Introduction – Yaskawa DriveWizard AC Drive User Manual
Page 105
Advertising
Introduction
Introduction
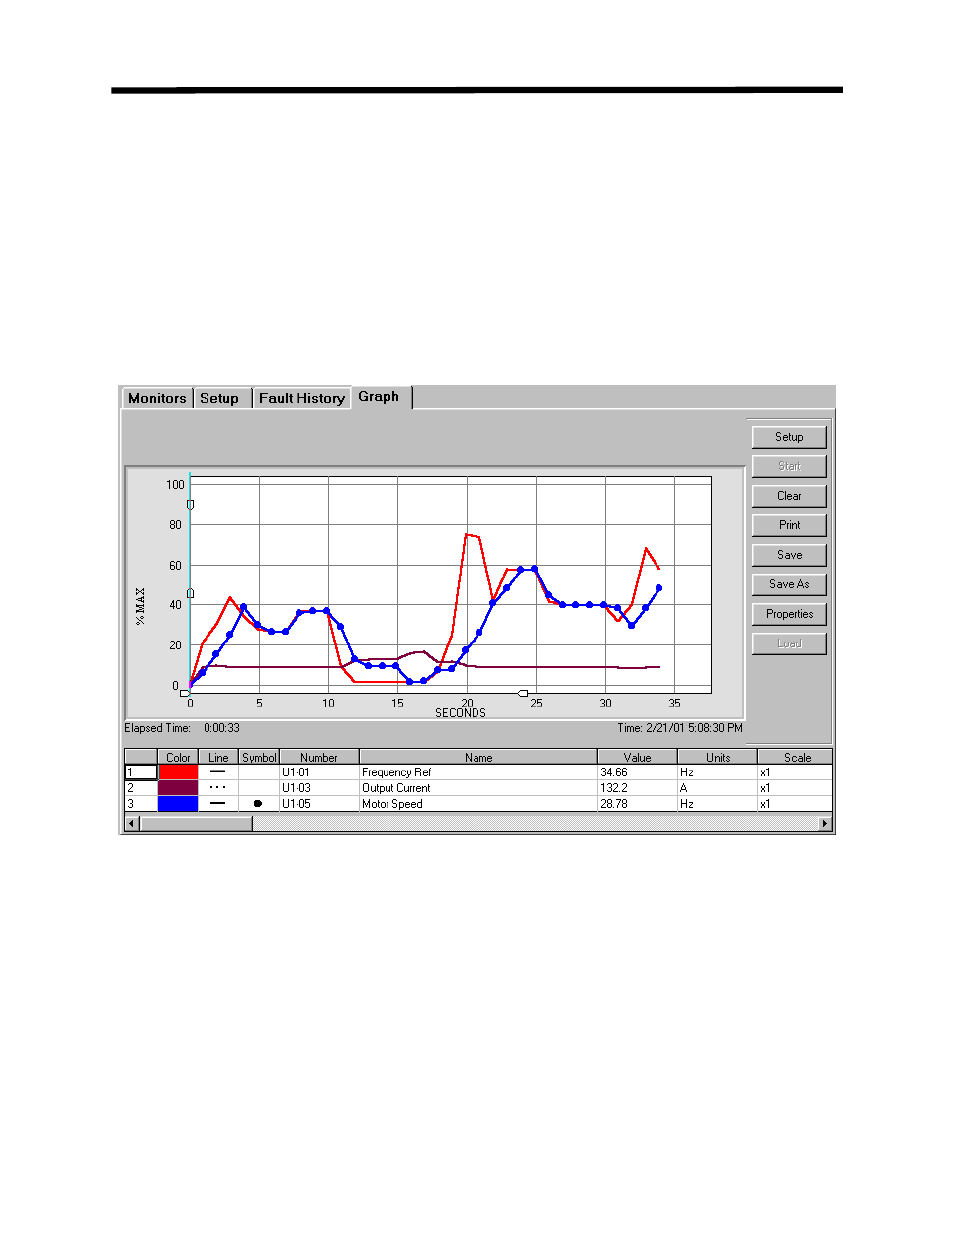
The graphing function in DriveWizard
™ is used to collect and display data from the drive in a
graphical format.. Up to 8 monitor values can be graphed at the same time. These monitor values
can be any item available from the monitoring function (see Chapter 5). The time base for
sampling is settable by the user in 1,10, 30, and 60 second intervals under serial communications
and 0.1,1.0, 10.0, 30.0 and 60.0 second under Ethernet communications. The graphing display
can be re-sized to expand or shrink either the X or Y axis of the display.
Figure 7.1: Sample of the Graphing Area
105
Advertising
See also other documents in the category Yaskawa Equipment:
- Tag Generator (30 pages)
- MP3300iec (82 pages)
- 1000 Hz High Frequency (18 pages)
- 1000 Series (7 pages)
- PS-A10LB (39 pages)
- iQpump Micro User Manual (300 pages)
- 1000 Series Drive Option - Digital Input (30 pages)
- 1000 Series Drive Option - CANopen (39 pages)
- 1000 Series Drive Option - Analog Monitor (27 pages)
- 1000 Series Drive Option - CANopen Technical Manual (37 pages)
- 1000 Series Drive Option - CC-Link (38 pages)
- 1000 Series Drive Option - CC-Link Technical Manual (36 pages)
- 1000 Series Drive Option - DeviceNet (37 pages)
- 1000 Series Drive Option - DeviceNet Technical Manual (81 pages)
- 1000 Series Drive Option - MECHATROLINK-II (32 pages)
- 1000 Series Drive Option - Digital Output (31 pages)
- 1000 Series Drive Option - MECHATROLINK-II Technical Manual (41 pages)
- 1000 Series Drive Option - Profibus-DP (35 pages)
- AC Drive 1000-Series Option PG-RT3 Motor (36 pages)
- Z1000U HVAC MATRIX Drive Quick Start (378 pages)
- 1000 Series Operator Mounting Kit NEMA Type 4X (20 pages)
- 1000 Series Drive Option - Profibus-DP Technical Manual (44 pages)
- CopyUnitManager (38 pages)
- 1000 Series Option - JVOP-182 Remote LED (58 pages)
- 1000 Series Option - PG-X3 Line Driver (31 pages)
- SI-EN3 Technical Manual (68 pages)
- JVOP-181 (22 pages)
- JVOP-181 USB Copy Unit (2 pages)
- SI-EN3 (54 pages)
- SI-ET3 (49 pages)
- MECHATROLINK-III (35 pages)
- EtherNet/IP (50 pages)
- SI-EM3 (51 pages)
- 1000-Series Option PG-E3 Motor Encoder Feedback (33 pages)
- 1000-Series Option SI-EP3 PROFINET (56 pages)
- PROFINET (62 pages)
- AC Drive 1000-Series Option PG-RT3 Motor (45 pages)
- SI-EP3 PROFINET Technical Manual (53 pages)
- A1000 Drive Option - BACnet MS/TP (48 pages)
- 120 Series I/O Modules (308 pages)
- A1000 12-Pulse (92 pages)
- A1000 Drive Software Technical Manual (16 pages)
- A1000 Quick Start (2 pages)
- JUNMA Series AC SERVOMOTOR (1 page)
- A1000 Option DI-101 120 Vac Digital Input Option (24 pages)