Graph time display – Yaskawa DriveWizard AC Drive User Manual
Page 118
For both the horizontal and vertical scales, the cursor can be positioned in-
arrows until a doubled sides arrow (
b
le’s
etween a sca
) appears. Drag this left and right to
window you have zoomed in on. For example, a 0-10 second window can
the 20-30 second time period.
If the graph is cleared, the horizontal scale must be re
by dragging the right arrow all the way right and the
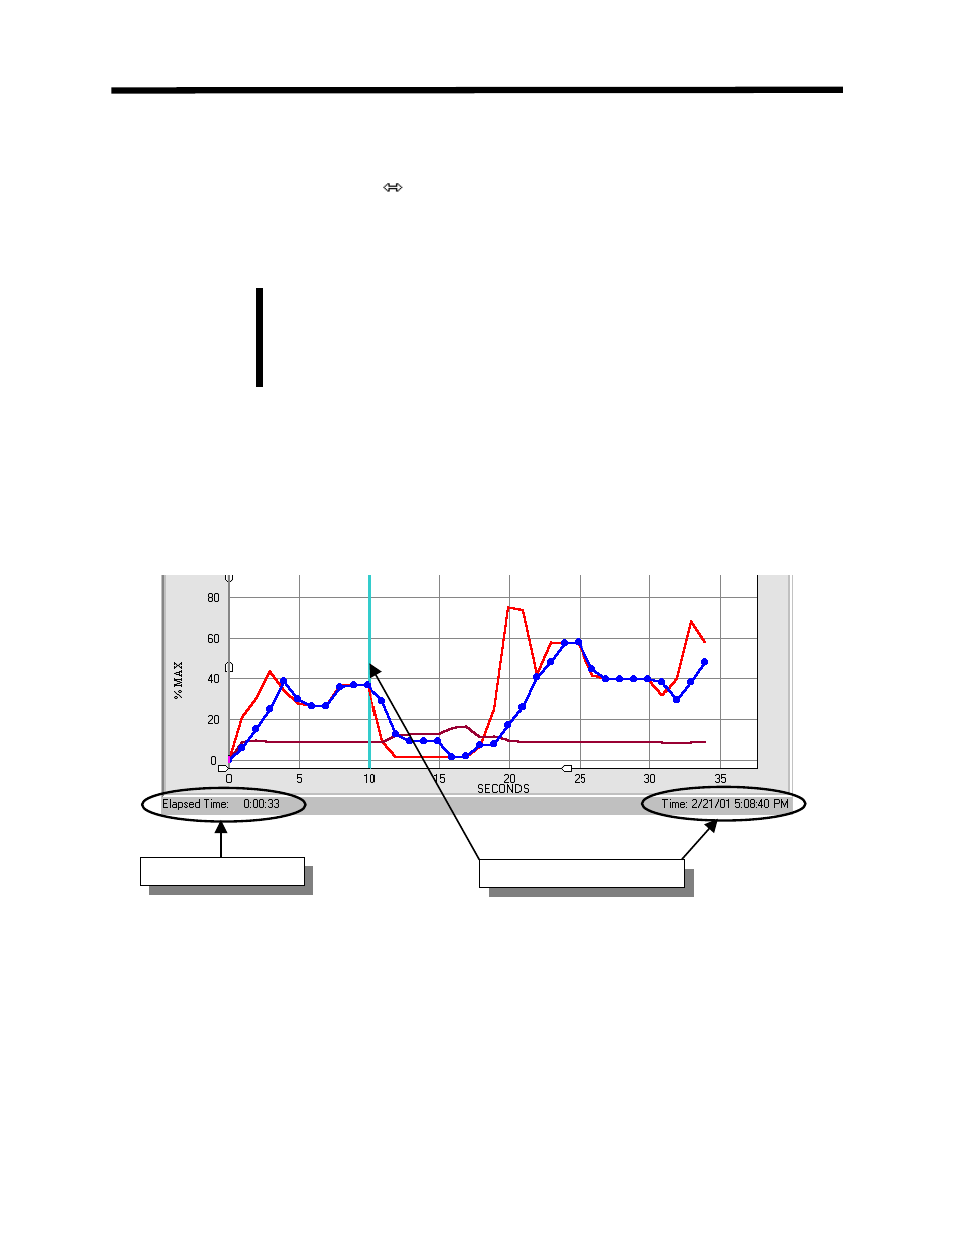
Graph Time Display
There are two displays that show the amo
lapsed time readout on the lower left-hand
e marker. (Fig 7.15)
move the whole
be moved to display
set also. This is done
left arrow back to 0.
unt of time that the monitor data was stored. An
side shows the total time the graphing was on. A
e
time display on the lower right-hand side shows the time at the vertical tim
Figure 7.15: Graph Tim
e far left-hand side
e Data Marker
A vertical bar (normally at th
of the graph display) can be dragged over the
graph. The time stamp will show the time at the bar. The value column of the graph
spreadsheet will show the data value at the bar. The graphing must be in stopped in order to use
this function
.
Note!
Total Stored Time
Time Stamp at Vertical Bar
Graphing Function Details
118