Changing the graphing window (‘zooming’) – Yaskawa DriveWizard AC Drive User Manual
Page 117
- The scale at which the parameter is being graphed.
- After graphing, this is the lowest value the parameter reached over the course o
the whole graph. If nothing ha
f
s been graphed ye , this (--) is displayed.
t
- After gr phing, this is the highest value the parameter reached. If nothing has
been graphed yet, this (--) is displayed.
Changing the Graphing Window (‘zooming’)
of the graphing window can be resized or zoomed in or out to
ved analysis. The zooming is done via mouse dragging of graph
onitors Tab. The number in the Max column equals 100% on the vertical scale.
To zoom in on the vertical scale, pull the top arrow towards the bottom arrow and vice-versa.
For example, when DriveWizard
™ is initially started, the vertical scale goes from –150% to
150%. To zoom in on the 0-100% area, pull the bottom arrow (
a
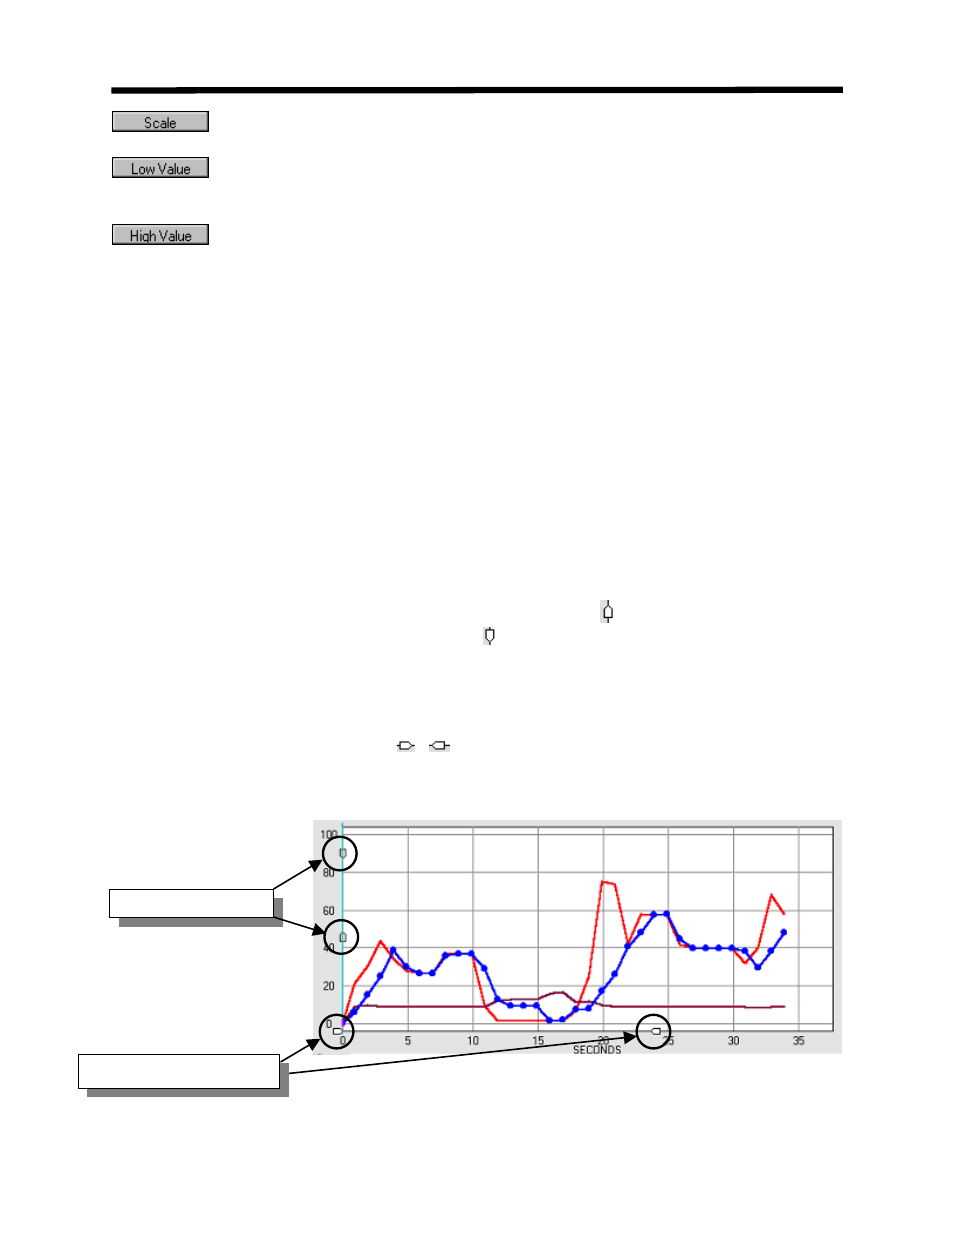
The vertical and horizontal axis
highlight the data for impro
display controls (Fig 7.14).
The vertical scale has a range from –150% to 150% of the maximum value of the parameter
being graphed. 100% of the value being graphed may be found by selecting the parameter being
graphed under the Setup Tab in the monitors area and then examining the Max column under the
M
) up until only the 0% and up
gridlines are displayed. Then pull the top arrow ( ) down until 0-100% is displayed.
The horizontal scale starts with a 0-60 second window displayed. This window can be shrunk
with the zooming arrows, or the window can increase if the graph runs for greater than 60
seconds. The arrows may then be dragged apart to view the entire graphing time period.
Likewise, after graphing, the arrows (
,
) may also be dragged closer together to zoom in on
something or farther apart to zoom out.
Figure 7.14: Graph Zoom Controls
Graphing Function Details
Vertical Scale Zoom
Horizontal Scale Zoom
117