Graph column definitions – Yaskawa DriveWizard AC Drive User Manual
Page 116
Graphing Function Details
5) The
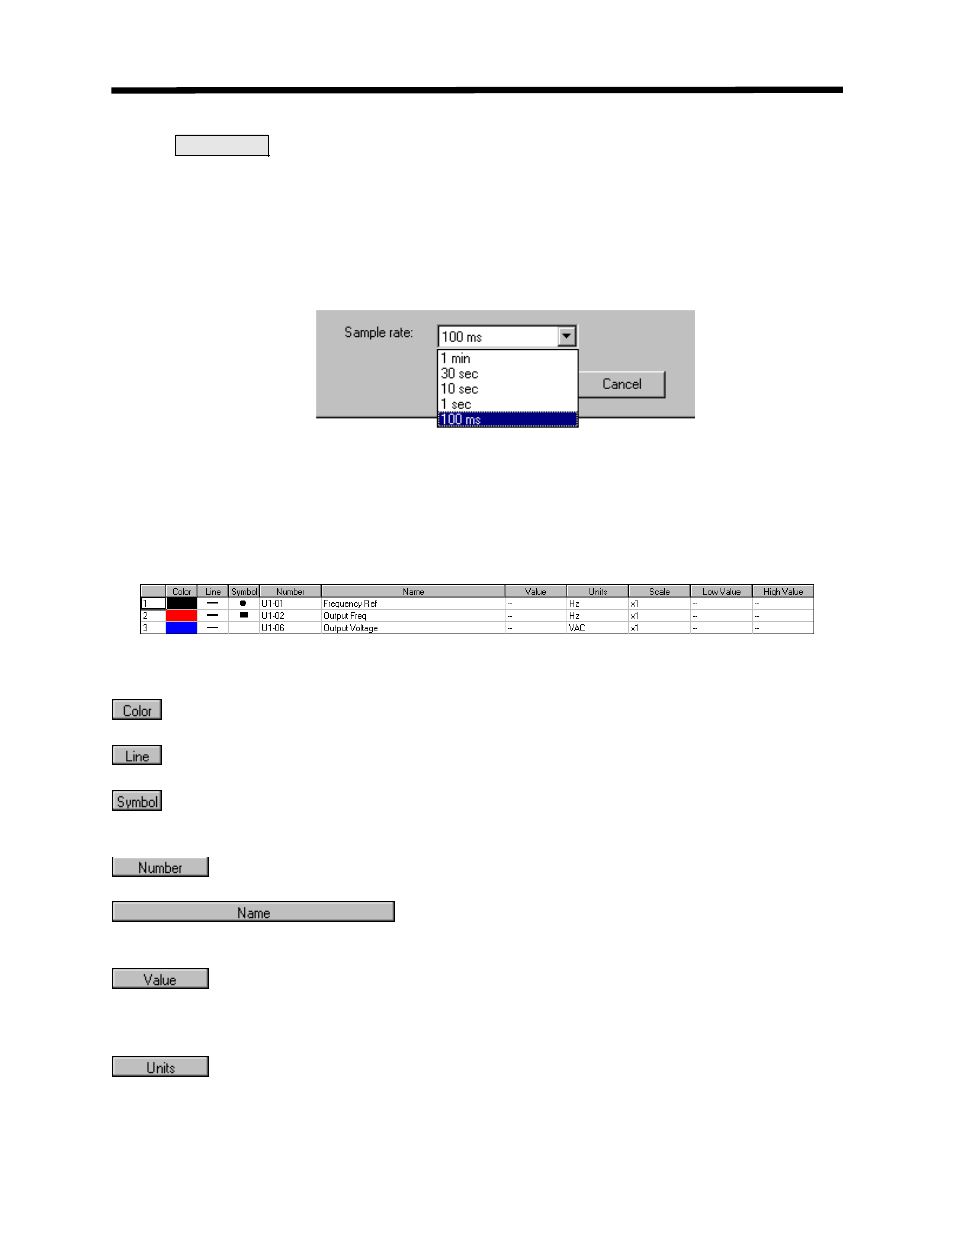
Sample rate
of the graphing data or the amount of time per point can be set with this
drop down box. Clicking on the down arrow will display a list of sample rates available (Fig
• Serial Communications: 1, 10, 30, and 60 seconds can be selected (100 mS NOT
available.)
nds can be selected.
7.12) Select a new sample rate and click on OK to close the window. The default rate is 1
second
• Ethernet Communications: 0.1, 1, 10, 30, and 60 seco
Figure 7.12: Sample Rate Selections (Ethernet Shown)
raph Column Definitions
G
There is a spreadsheet under the graphing chart that shows all of the monitor points that are
being graphed and the current value of the graphed monitor points (Fig 7.13).
Figure 7.13: Graph Spreadsheet Columns
- The color of the line being graphed.
- The type of line used for graphing (ie solid, dash, dot, etc)
- The symbol here matches the symbol on the line for that parameter. If this box is blank,
no symbol will be displayed on the line.
- These are the numbers of the parameters currently being graphed.
- A brief description of the parameter being graphed. This
name typically matches the description given in the appropriate drive manual.
- Displays the value of the parameter being graphed. While graphing this number is
eter. If graphing is not taking place, click on a point in the graph
and the value of that point will be displayed here.
the current value of the param
- The units the parameters are displayed in.
116