Yaskawa DriveWizard AC Drive User Manual
Page 111
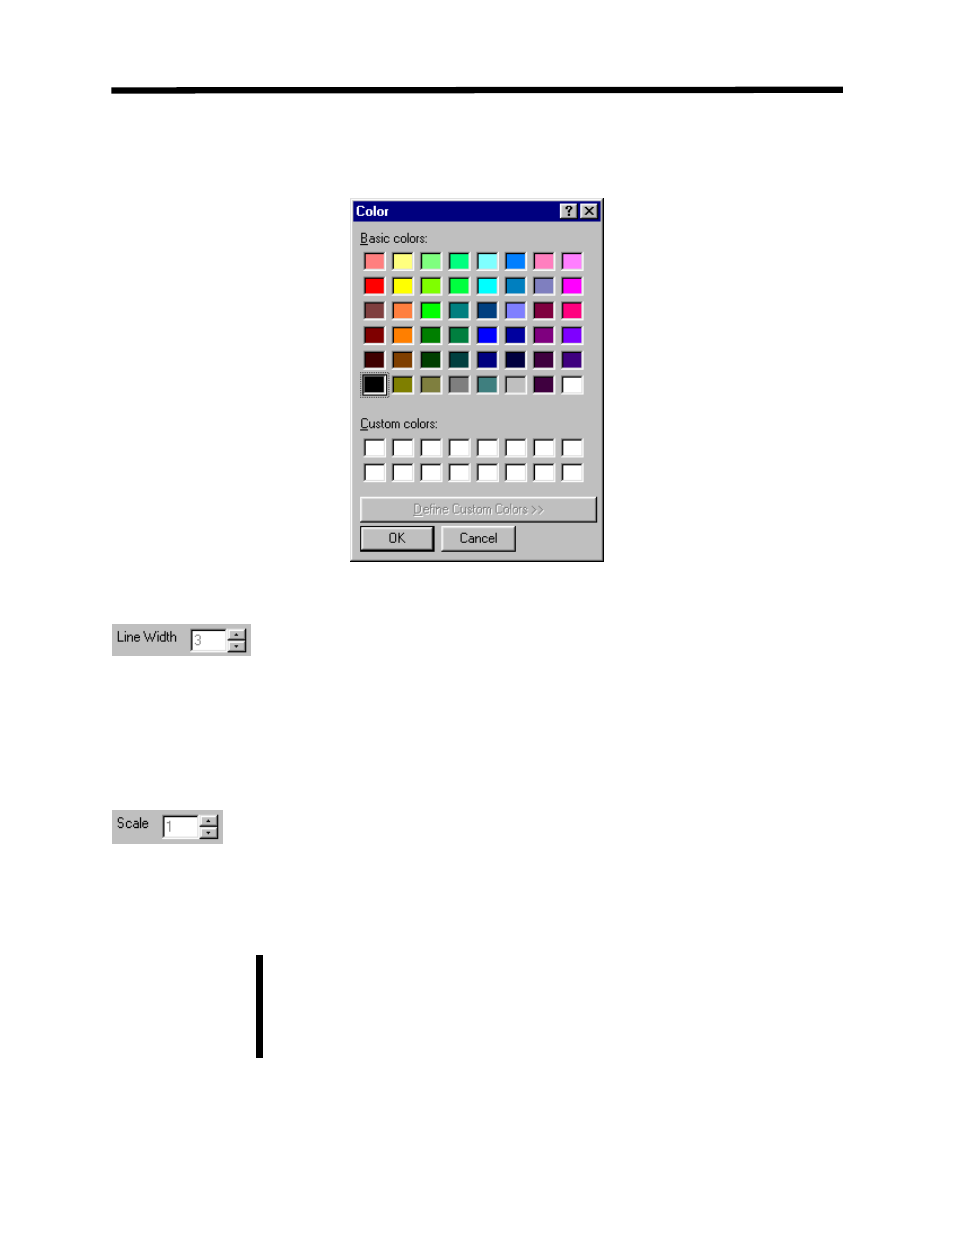
To select a different color, simply click on the new color.
Figure 7.7: Color Selection Menu
:
eing graphed. When selecting line thickness,
xample, if line 3 is thicker than line 1, line 3
is still seen displayed
mallest line number has
Line Width determines how thick the line is when b
the latest line will be foremost in the graph. For e
will be seen and not line 1; however, if line 1 is thicker than line 3, line 3
over line 1. To avoid accidentally hiding a line, always make sure the s
the largest width.
:
Scale determines what the value of the item being graphed is multiplied by while being graphed.
This does not affect the scale of the value displayed in the Value column below the graph. This
is very useful for observing items with small changes in value (example: while graphing DC Bus
Voltage with very little load).
The graphing scale of 1 = 100% which is the maximum defined by the
monitor scaling. Example: U1-17 is the analog input with a scale maximum
of 200%. With a graphing scale of 1, the graph line will be at 50% when the
analog input is 100%.
Note!
Graphing Function Details
111