Channel plot panel, Channel plot panel -101 – Altera JNEye User Manual
Page 107
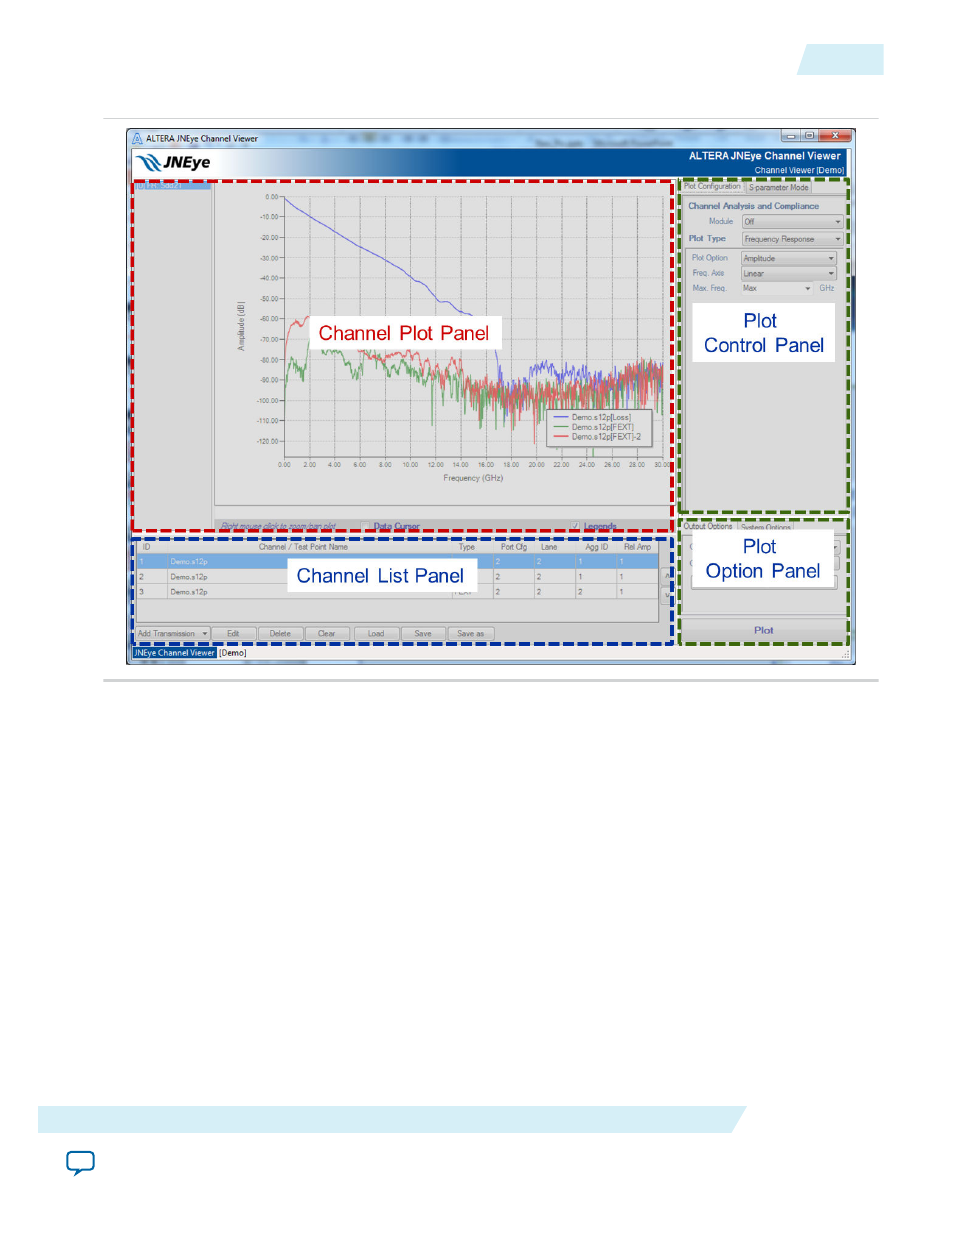
Figure 2-80: JNEye Channel Viewer GUI Panel Partitions
Channel Plot Panel
This panel contains the Channel Viewer and Plot Selector. The JNEye Channel Viewer shows the
characteristics of the channels in the channel list with the plot options specified. Use the Channel Viewer
to plot channels with different options and browse the plots. Use the Plot Selector to choose one of the
existing plots.
The Channel Viewer provides the following GUI capabilities:
• Zoom In, Zoom Out, Pan, Data Select—Right-click on the Channel Plot panel to select one of these
functions. To zoom in on the plot, select Zoom In and then click and drag a rectangle box to show the
details of the plot. To zoom out, select Zoom Out. Up to ten previous scalings are saved, so you can
restore older versions by clicking Zoom Out more than once. To pan over the plot, select Pan and
then click and drag the plot.
• Data Cursor—By checking the Data Cursor radio button, the data cursor boxes will show. You can
select and drag a data cursor box with the data values shown in the box. The data values are colored
according to the data lines.
• Legends—Plot legends are shown when plots are generated. Use the Page-Up, Page-Down, Home,
and End keys on the keyboard to move the legend box. You can also check or uncheck the Legends
check box to show or hide the legend box.
UG-1146
2015.05.04
Channel Plot Panel
2-101
Functional Description
Altera Corporation