Altera JNEye User Manual
Page 88
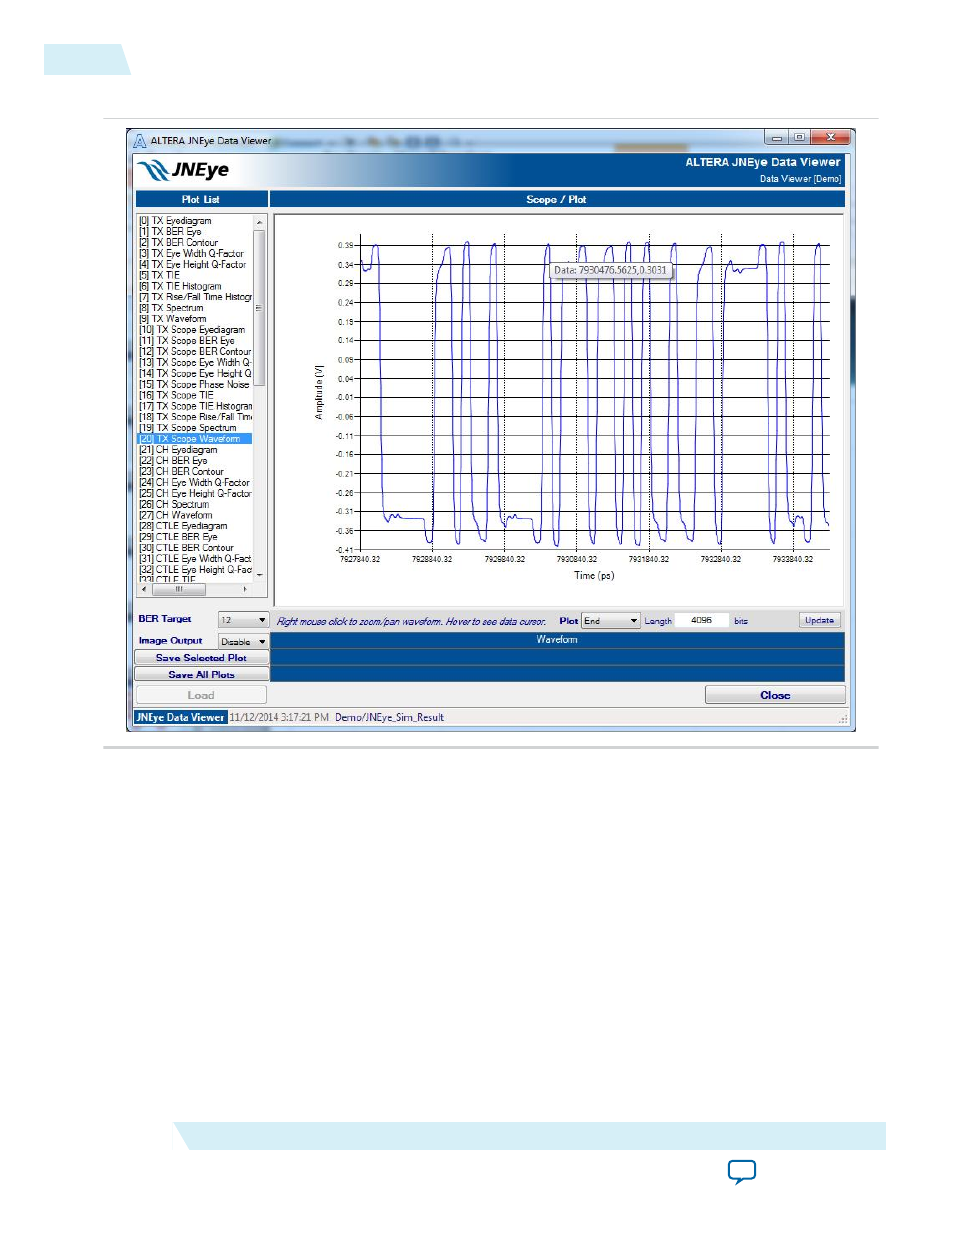
Figure 2-65: Data Cursor Example for Waveform Plot
• Legends—Plot legends are shown when plots are generated. Use the Page-Up, Page-Down, Home,
and End keys on the keyboard to move the legend box. Turn the Legends check box on or off to show
or hide the legend box.
Within the Data Viewer, you can modify the link’s BER target using the BER Target menu. The JNEye
Data Viewer recalculates the jitter and the eye-opening height and width dynamically, because the JNEye
Simulation Engine has pre-calculated the results at different BER targets in the simulation range.
Use the Colormap menu to change the color map of eye diagrams within the Data Viewer. JNEye
provides eight different color maps that you can choose from, depending on your analysis purpose and
visual preferences. The color maps can be divided into two groups:
• Logarithmic Color Scale—Default, Blue, Heat, and Bone
• Linear Color Scale—Default Linear, Blue Linear, Heat Linear, and Bone Linear
The logarithmic color scale provides good visual performance in displaying low probability data points
such as the low BER portion of an eye diagram. The linear color scale is more suitable for showing minor
differences in close-range data values. The Blue/Blue Default Linear is good for showing deterministic
2-82
JNEye Data Viewer Module
UG-1146
2015.05.04
Altera Corporation
Functional Description