Altera JNEye User Manual
Page 115
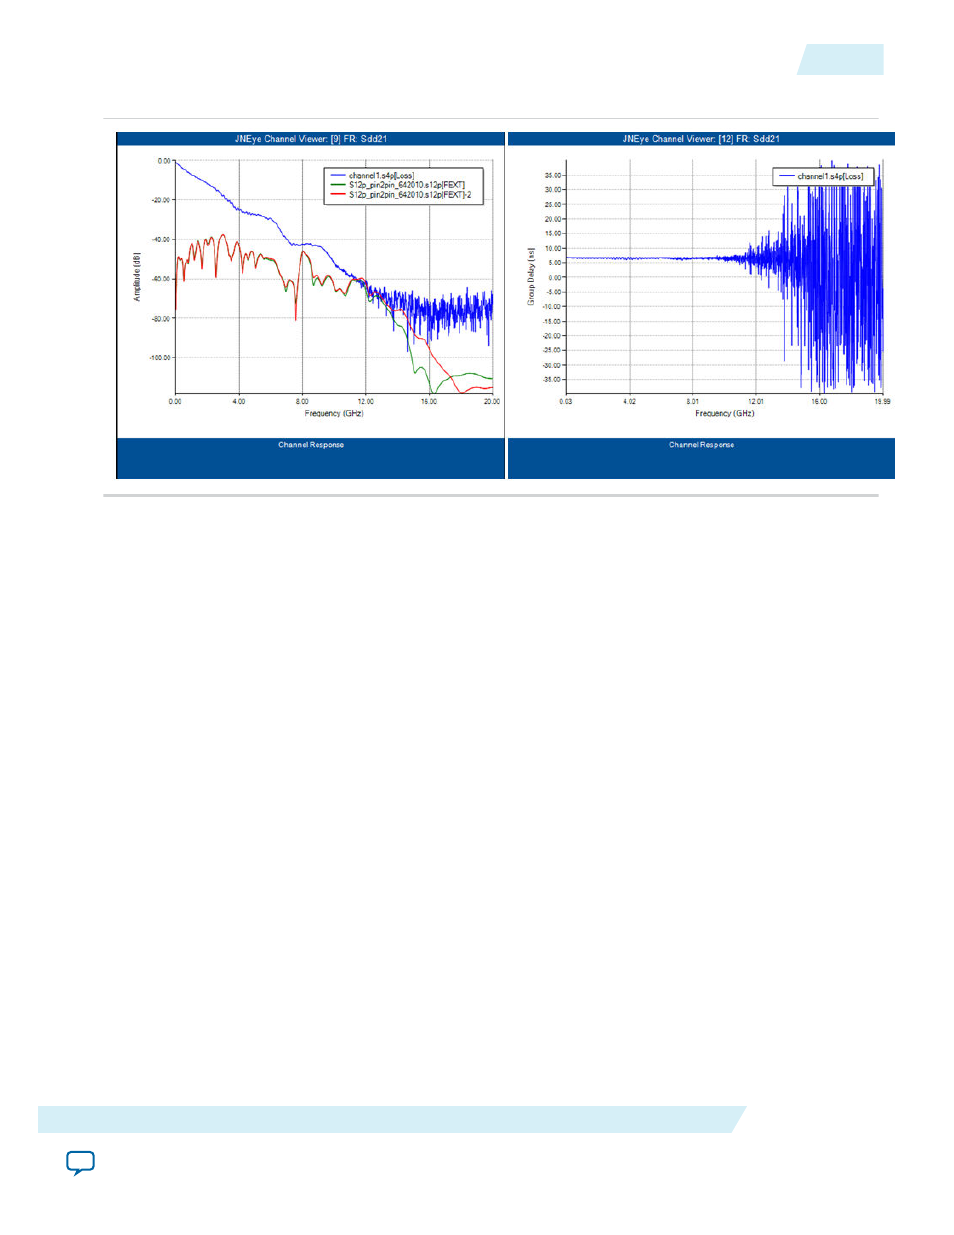
Figure 2-88: Typical Frequency Domain Channel Characteristics Plots
The JNEye Channel Viewer plots the channels’ amplitude and group delay frequency responses in a linear
or logarithmic frequency scale. It also allows you to limit the plot frequency range. When multiple
transmission channels (such as loss or victim) are in the Channel List, you can plot the cascaded channel
response by turning on the Plot Combined Channel Response option in the Systems Options panel. An
example of a combined channel response is shown in the following figure, in which a lossy backplane
channel is cascaded with a 5” microstrip PCB trace.
Note: JNEye only cascades or combines victim transmission channels. Crosstalk channels are not
combined (with the loss channels) in the plot.
UG-1146
2015.05.04
Plot Configuration Panel
2-109
Functional Description
Altera Corporation