Altera JNEye User Manual
Page 167
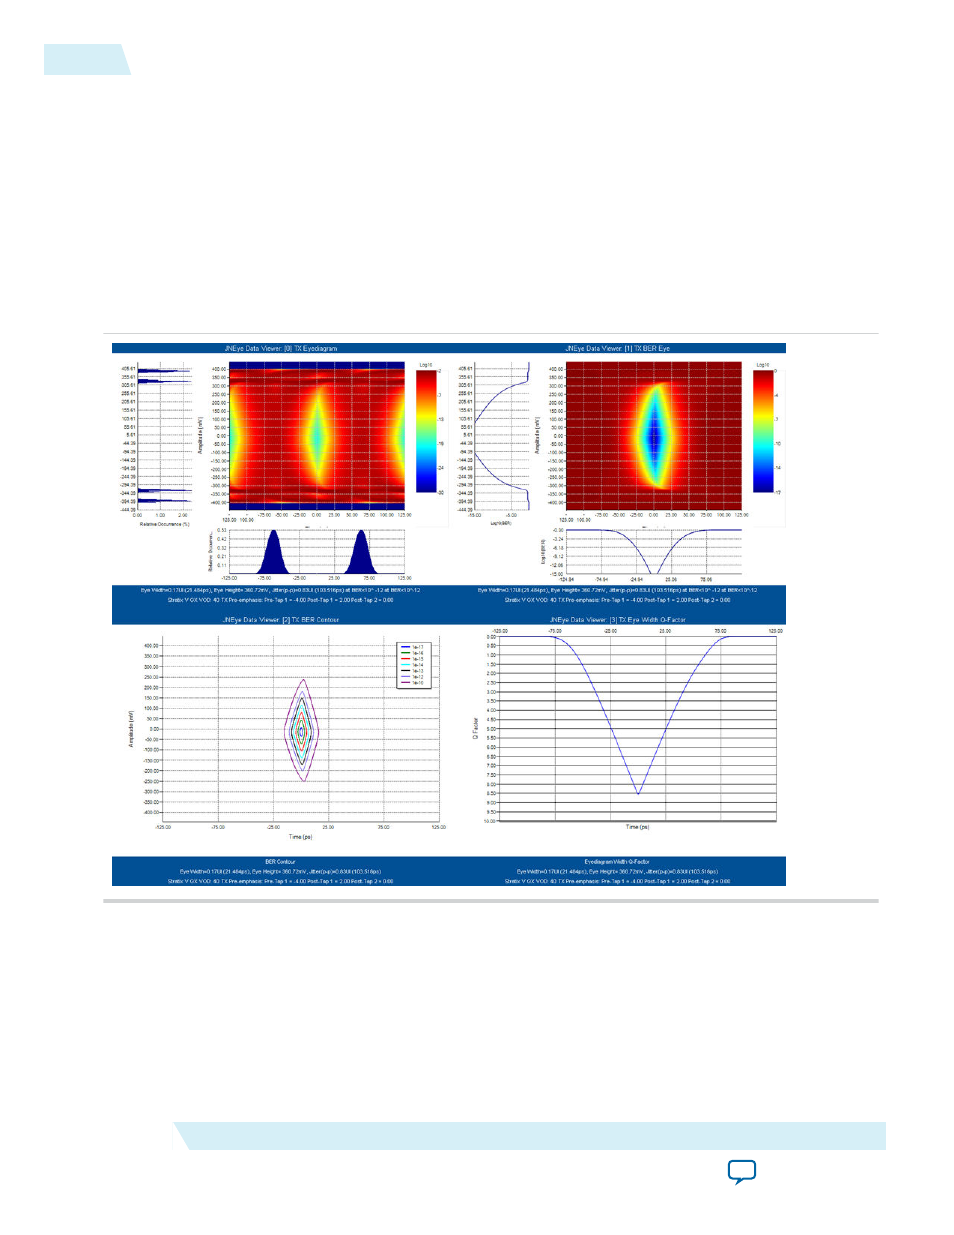
• The first figure is a hybrid eye diagram that includes deterministic jitter and probability density
function (PDF) because of unbounded jitter and noise sources.
• The second figure (top right) contains the cumulative distribution (CDF) eye diagram with BER
bathtub curves (for both width and height in the eye diagram opening).
• The third plot (lower left) is a BER contour plot that shows the eye diagram opening area at various
BER targets.
• The fourth plot shows Q-Factor curves, which are another representation of BER bathtub curve using
Q-factor by assuming the noise/jitter is Gaussian.
With the Gaussian random jitter injected into the link, the BER bathtub and Q-Factor plots clearly show
the effects where this unbounded jitter narrows the eye diagram width as the BER target reduces.
Figure 3-15: TX Output Hybrid Eye Diagrams and BER Analysis Measured with Ideal Clock
The second set of TX outputs are measured with the golden CDR, which has a loop bandwidth of 1/1667
of the data rate. This set of outputs reflects the common lab scope measurement. With the golden CDR in
place, the low frequency jitter and noise, which are included in phase noise and spurs, are tracked.
The following figure shows the Time Interval Error (TIE) plots before and after the golden CDR. With
reference to the ideal clock (that is, before the golden CDR), the low frequency sinusoidal jitter from the
reference clock characteristics can be clearly observed in the plot on the left. After the golden CDR, those
low frequency sinusoidal jitters are tracked as shown in the plot on the right. The figure also shows the
jitter components results that reflect the effects of the golden CDR (Beta feature).
3-16
Analysis
UG-1146
2015.05.04
Altera Corporation
Tutorial: PCI Express 8GT