Altera JNEye User Manual
Page 188
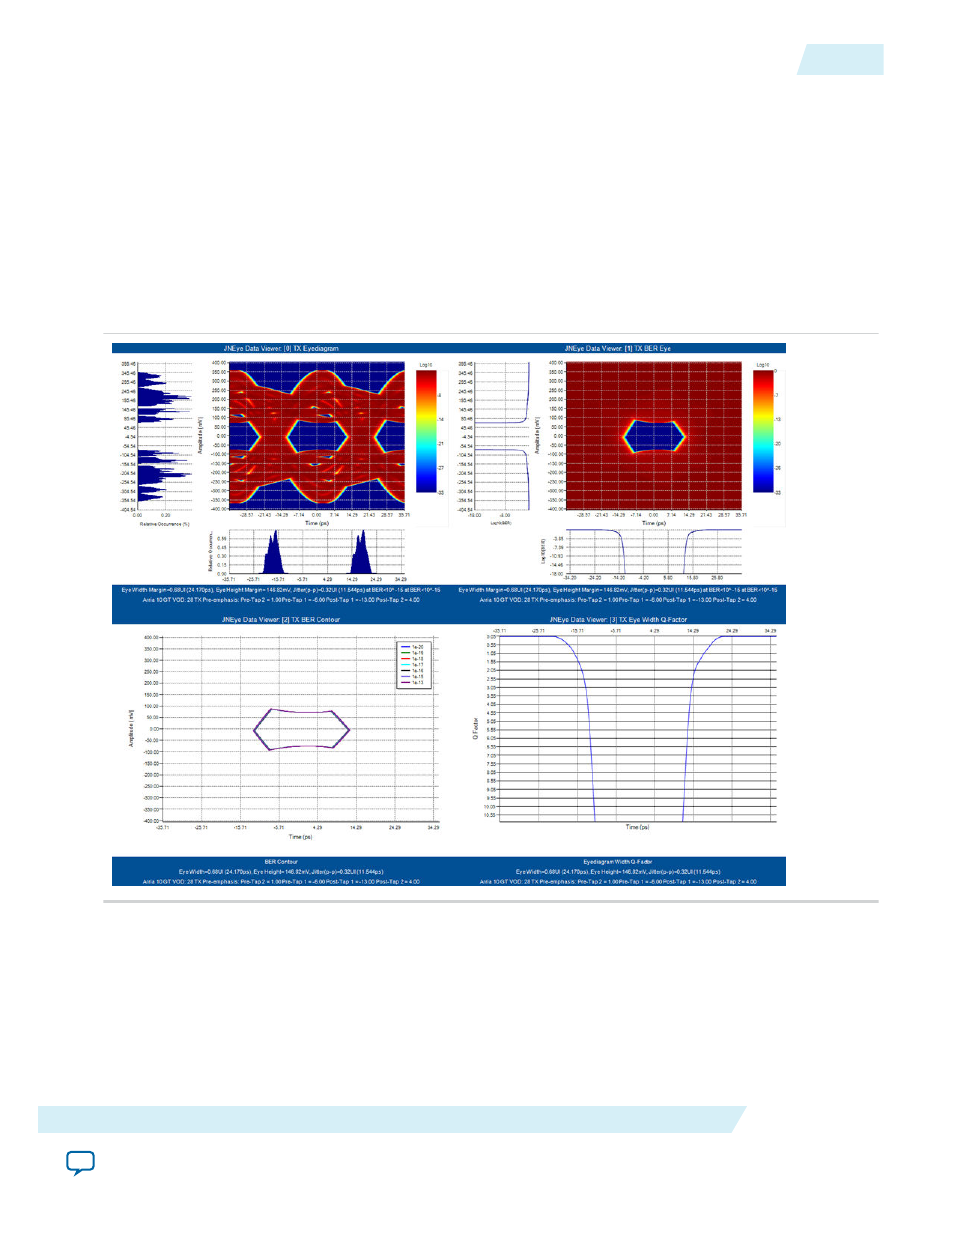
• The first figure (top left) is a hybrid eye diagram that includes deterministic jitter and probability
density function (PDF) because of unbounded jitter and noise sources.
• The second figure (top right) contains the cumulative distribution (CDF) eye diagram with BER
bathtub curves (for both width and height in the eye diagram opening).
• The third plot (lower left) is a BER contour plot that shows the eye diagram opening area at various
BER targets.
• The fourth plot shows Q-Factor curves, which are another representation of BER bathtub curve using
Q-factor by assuming the noise/jitter is Gaussian.
With the Gaussian random jitter injected into the link, the BER bathtub and Q-Factor plots clearly show
the effects where this unbounded jitter narrows the eye diagram width as the BER target reduces.
Figure 4-10: TP1 Hybrid Eye Diagrams and BER Analysis Measured with Ideal Clock
The second set of TX outputs are measured with the golden CDR, which has a loop bandwidth of 1/1667
of the data rate. This set of outputs reflects the common lab scope measurement. With the golden CDR in
place, the low frequency jitter (such as the 1 MHz sinusoidal jitter) and noise, which are included in phase
noise and spurs, are tracked.
When you enable a PLL in a transmitter, the reference clock’s phase noise is shaped and filtered with the
PLL’s response. For a demonstration of PLL and transmitter reference clock phase noise, refer to the
JNEye Tutorial: PCI Express 8GT.
UG-1146
2015.05.04
Analysis
4-11
Tutorial: 28 Gbps OIF VSR Link with Arria 10 GT
Altera Corporation