11 monitoring and auditing, Managing ect statistics chart – H3C Technologies H3C Intelligent Management Center User Manual
Page 152
143
11 Monitoring and auditing
VFM has the following monitoring and auditing functions:
•
ECT Statistics Chart—Enables you to sum up the number of B-VLANs and the number of I-SIDs in an
ECT algorithm.
•
VM Migration Info—Enables you to manage the migration information for a VM.
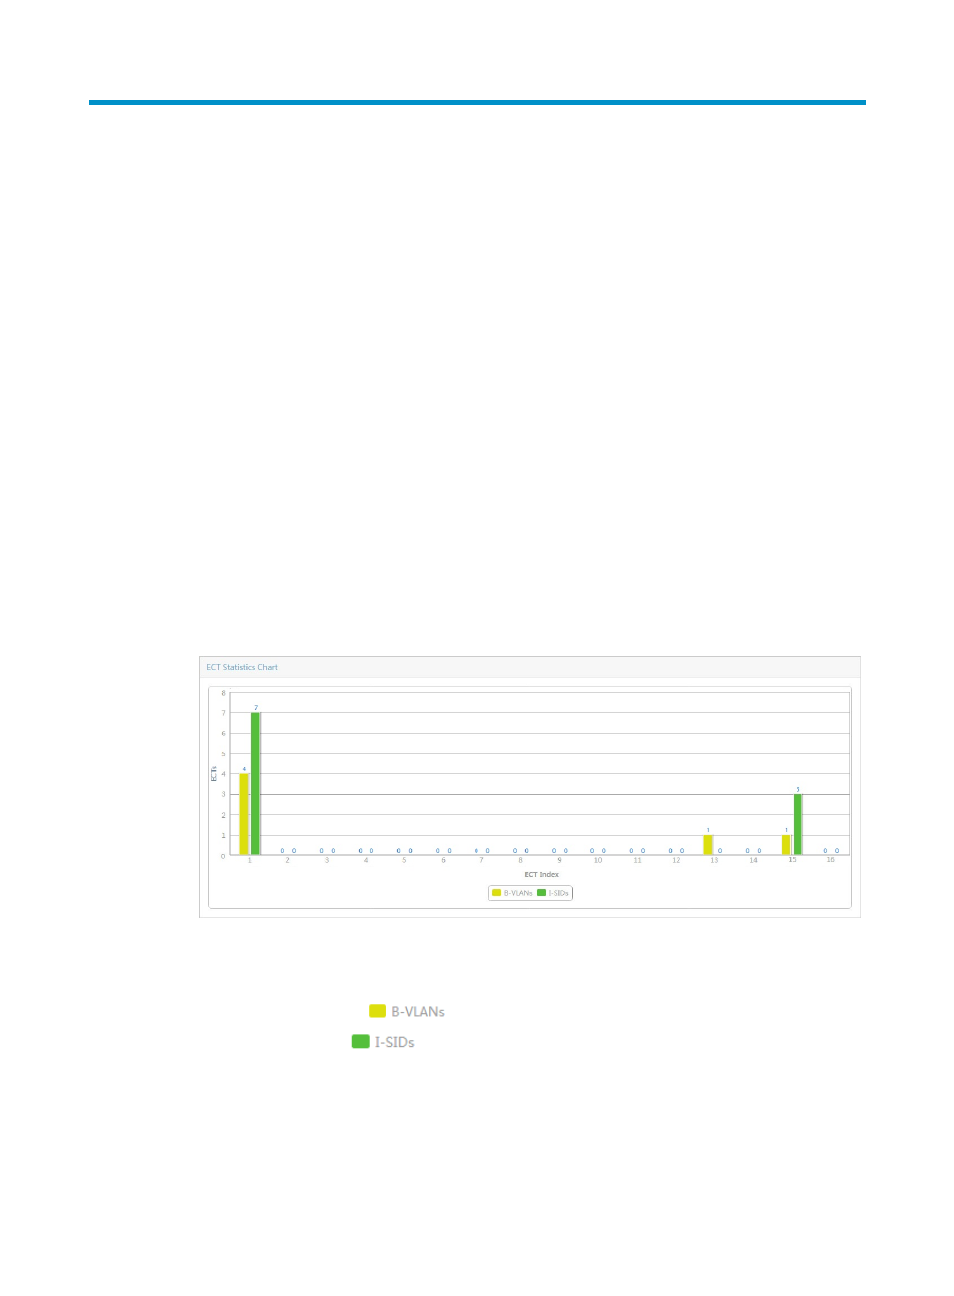
Managing ECT statistics chart
The ECT statistics chart displays the number of B-VLANs and the number of I-SIDs in each ECT algorithm,
and indicates the load condition of the ECT algorithm. You can balance the loads among the ECT
algorithms by adjusting the number of B-VLANs in each ECT algorithm.
To view the ECT Statistics Chart:
1.
Click the Service tab.
2.
From the navigation tree, select VAN Fabric Manager > Statistics > ECT Statistics Chart.
In the ECT statistics chart, the yellow column indicates the number of B-VLANs in an ECT algorithm,
and the green column indicates the number of I-SIDs. The specific number of B-VLANs or I-SIDs is
displayed on top of each column.
Figure 22 ECT Statistics Chart
The ECT statistics chart enables you to perform the following operations:
•
Hover over a column to display the specific number of B-VLANs or I-SIDs in a tip.
•
Click the B-VLANs icon
to display or hide the columns of B-VLANs.
•
Click the I-SIDs icon
to display or hide the columns of I-SIDs.