Guralp Systems Scream User Manual
Page 30
Scream! 4.5
this, Scream! needs to know the sensitivities of your digitiser and
instrument (see Section 3.8 on page 21).
4.1.3 Printing
To print the data currently being displayed in the Waveview window,
click on the Print icon
. Scream! will use the current default
printer settings to print a full page view of the window, using the
current amplitude and time scaling, filtering and other display
options. You can print at any time, in either real-time or paused mode.
To print the same data in black and white (on a colour or grey-scale
printer), click on the arrow beside the Print icon and select Page Print
(monochrome) from the drop-down menu. Black and white output is
more suitable for copying or faxing.
You can also set up Scream! to print automatically, or send data
directly to a connected plotter. For full details on the printing options
available in Scream!, see Chapter 10 on page 119.
Note: The “print” facility is a good way to produce PDF
outputs of waveforms, by using a PDF printer-driver (e.g.
PDFcreator).
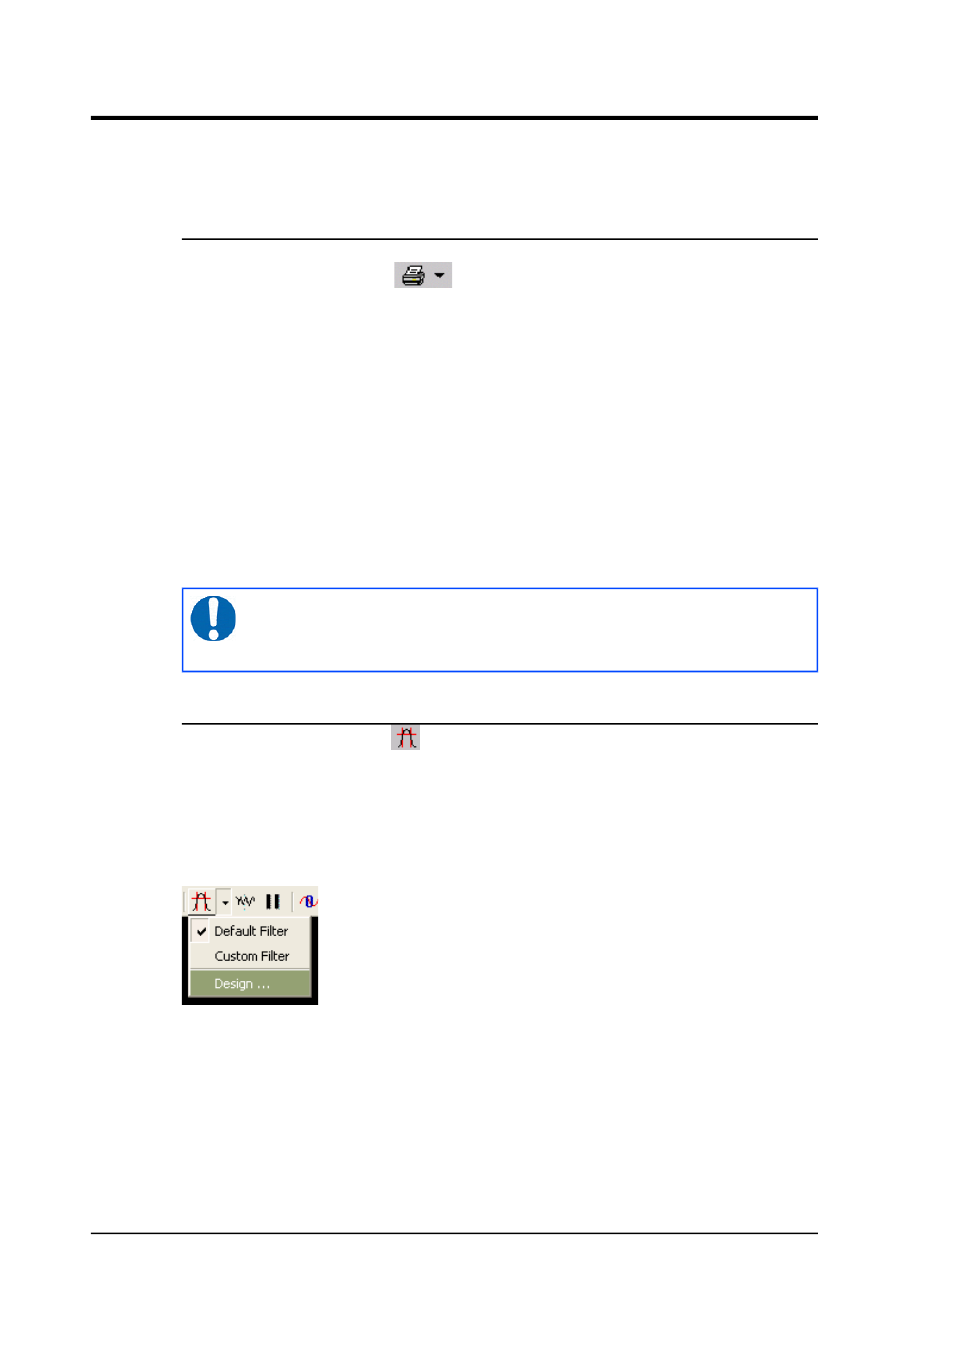
4.1.4 Filtering
Clicking the Filter icon
makes Scream! apply a filter to each of the
displayed streams. Click the icon again to disable the filter.
Scream! can be configured to apply different filters to each WaveView
window. To select the filter, click on the arrow beside the Filter icon.
A drop-down menu will appear.
•
Select Default filter to apply Scream's built-in FIR bandpass
filter. The properties of this filter depend on the sample rate of
the stream. Data at 1 or 2 samples per second are filtered with a
10 – 30 second pass-band, whilst data at other sample rates are
filtered with corner frequencies at 0.1 and 0.9 times the Nyquist
frequency of the stream. For example, the pass band for the
filter applied to a stream at 100 samples per second will be 5 –
45 Hz.
30
Issue K