3 display options – Guralp Systems Scream User Manual
Page 46
Scream! 4.5
5. If you want to view the spectrum of a different event, follow
steps 3 – 4, choosing Yes when you are asked if you want to
overlay the spectra. The old event spectrum will be replaced
with the new one.
6. If you want to change the background spectrum, follow steps 1 –
2 and choose No when you are asked if you want to overlay the
spectra. The old event spectrum will be erased, and the
background spectrum will be replaced with the new one. Now
follow steps 3 – 5 to overlay the spectrum of events as desired.
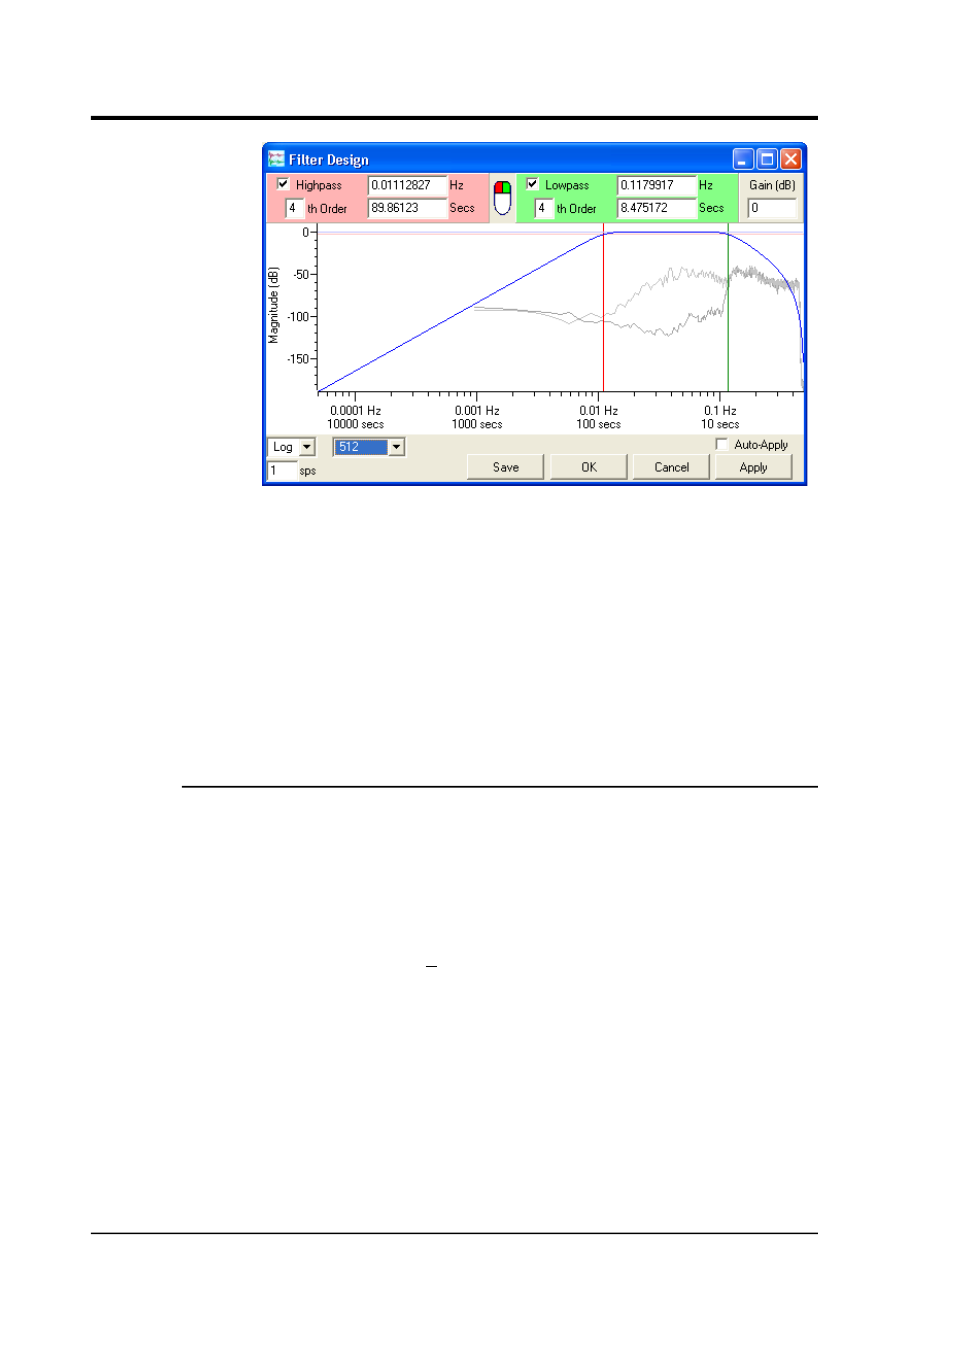
4.3.3 Display options
The icons at the bottom left of the Filter Design window change the
properties of the graph.
•
The Log/Lin selection box allows you to choose a logarithmic or
linear time axis. (The magnitude axis is always displayed in dB,
and is therefore logarithmic.)
•
Enter a value in the n sps box to display a time range suitable
for streams at that rate. The graph displays a four-decade
frequency range, up to the Nyquist frequency (i.e. half of the
sample rate).
•
When power spectra are being displayed on the graph, there is
an additional selection box to the right of the Log/Lin icon.
The power spectrum calculation uses the Welch averaging
periodogram algorithm. This algorithm produces frequency
graphs by splitting the range into windows of a certain size.
46
Issue K