3 the summary window – Guralp Systems Scream User Manual
Page 70
Scream! 4.5
You can resize the Status window, or drag the bar between the graphs
and the block display area, to see the graphs in more detail.
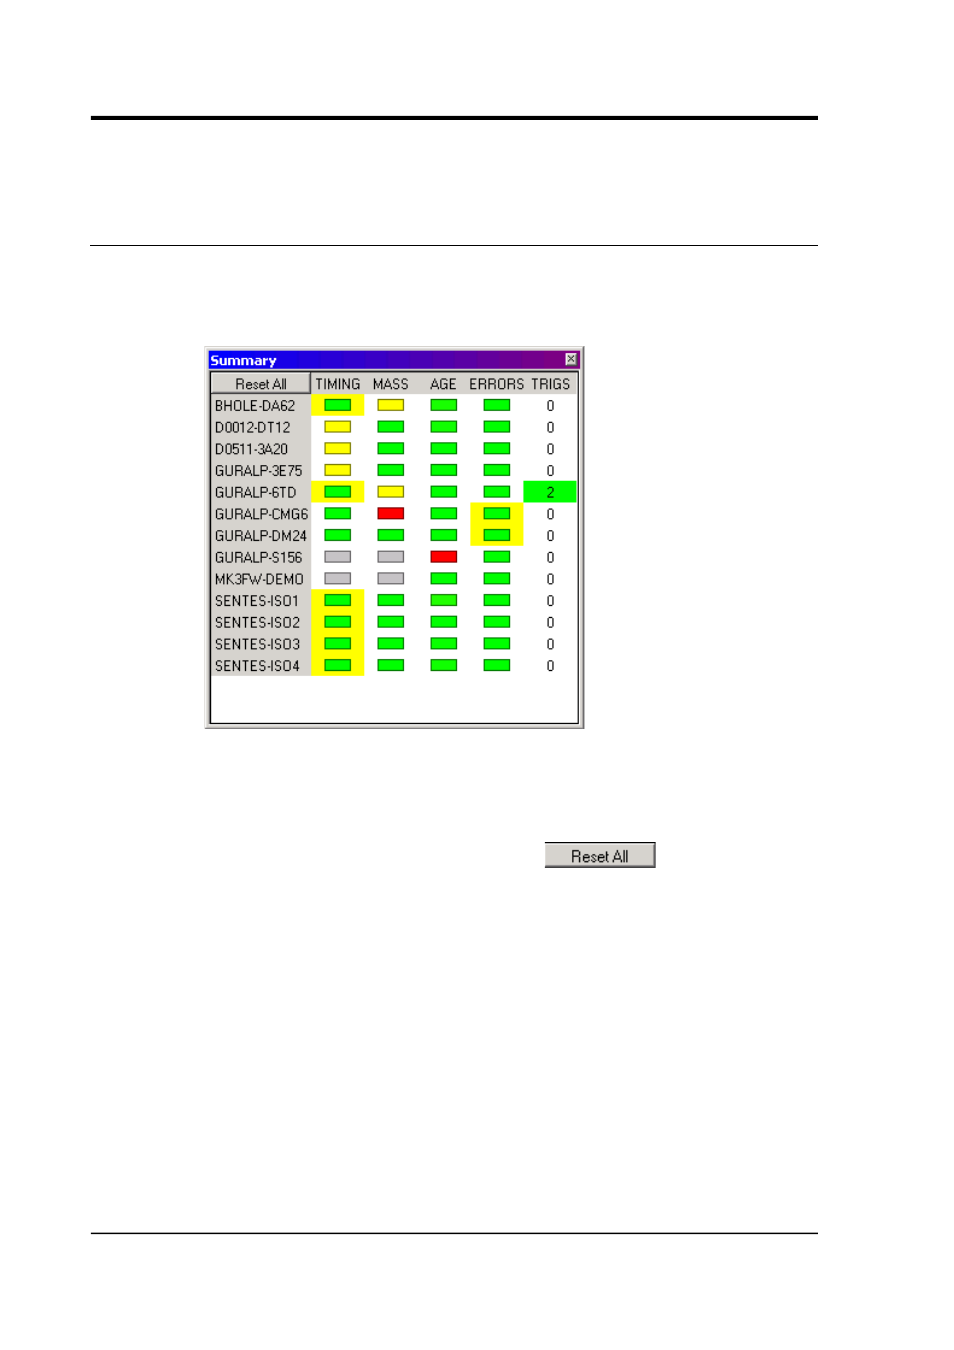
6.3 The summary window
This window provides at-a-glance state of health information about all
instruments on your network. To open it, choose Windows →
Summary window from Scream!'s main window.
Every instrument known to Scream! is listed in this window, with
coloured icons representing their timing, mass position and data flow
status. The window also reports how many triggers have been
communicated to Scream! in status blocks. To make Scream! forget all
this information and start afresh, click
. This will not
remove streams from the main window, the Waveview windows or the
stream buffer.
In the leftmost four columns, each entry is a coloured rectangle with a
border. A
grey
rectangle indicates that no relevant data have been
received from the instrument since Scream! was started.
Green
indicates that this measurement is satisfactory;
yellow
indicates that
some attention may be necessary, and
red
indicates that there is
probably a problem.
If a box has a coloured border, an unsatisfactory reading has been
received since the last reset, but the status has since improved. Thus,
if a box goes from yellow to green, the border will be coloured yellow
until you reset. If the same box subsequently turns red momentarily
and then returns to yellow or green, the border will change to red.
70
Issue K