Teac GigaStudio 3 User Manual
Page 174
174
175
This setting will affect the velocity dynamic range. Refer to the three diagrams that
show how these two settings (Velocity Curve and Velocity Dynamic Range) interact with
one another.
Vel dyn range (velocity dynamic range)
With this setting, you can lower or raise the dynamic range of the velocity response
of the filter. There are five response positions:
•1-High
•2-Medium high
•3-Medium
•4-Medium low
•5-Low
This setting varies dramatically depending on which velocity curve has been as-
signed. The next three diagrams will show how these two settings (Velocity Curve and
Velocity Dynamic Range) interact with each other.
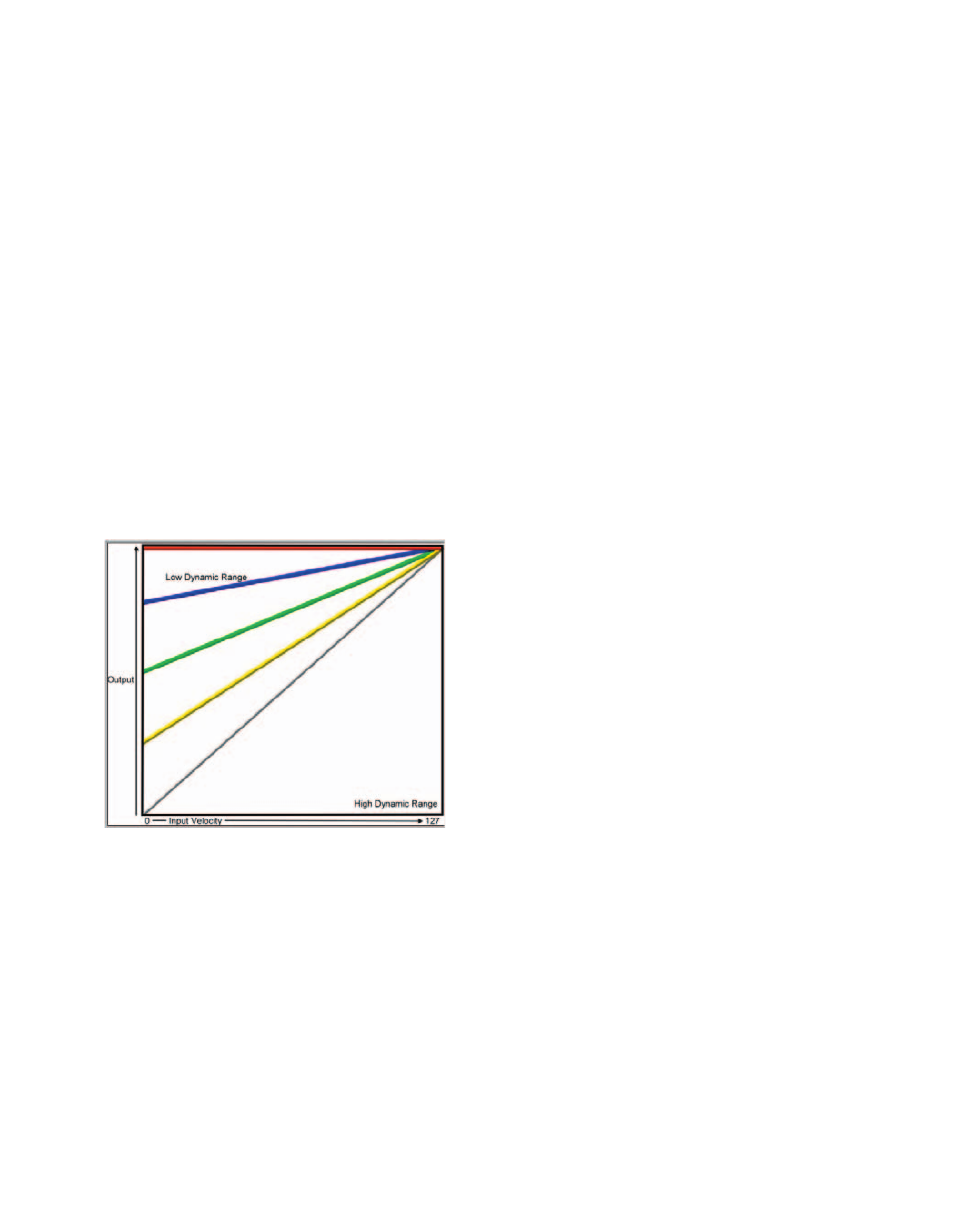
Linear Curve
Input velocity is proportional to the out-
put level depending on the type of curve
selected. Each line represents one of the five
dynamic range curves from top to bottom.
Low (all input velocities = 127)
Medium low (velocity is offset)
Medium (velocity is offset)
Medium high (velocity is offset)
High (input velocity = output velocity)
The vertical axis of the graph represents the output velocity level, which is derived
from the input velocity level shown along the horizontal axis. The top line (horizontal
all the way across) shows the Low Response Linear Curve, with all input velocities in-
terpolated as 127. Each of the diagonal lines represent each of the increasingly higher
response curves with the bottom line (shown at a 45 degree angle) indicates a High
Response Linear Curve with the input velocity being equal to the output velocity (no
interpolation).
The Non-Linear and Special Response Curves have similar behavior with increasingly
variable curves, depending on the selected dynamic range as well as fine tuning the re-
sponse curve with the Vel scale setting.