Process, I/o state – H3C Technologies H3C Intelligent Management Center User Manual
Page 128
114
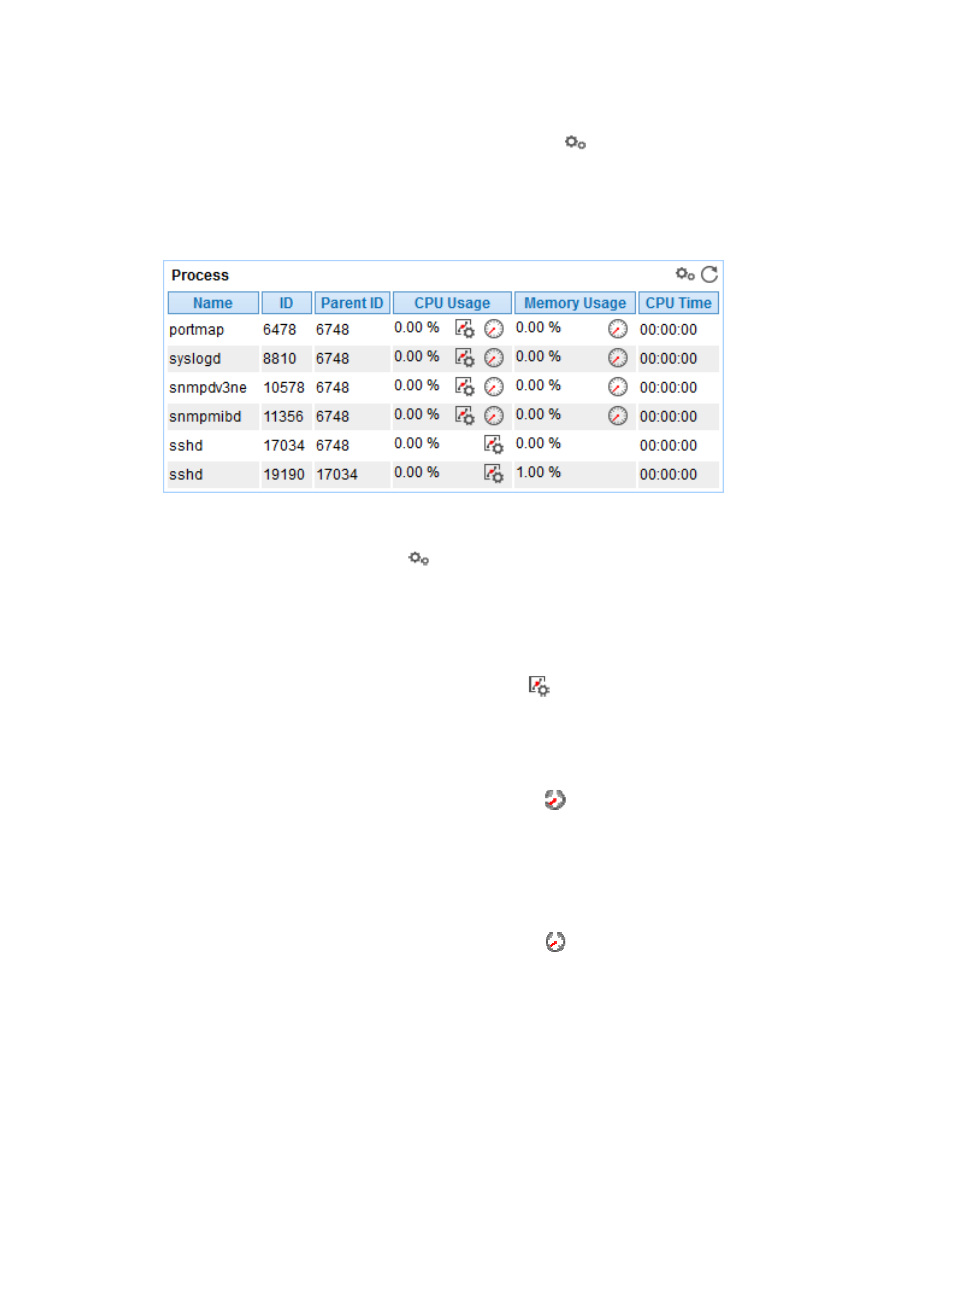
Process
To monitor a process on AIX, click the Configuration icon
to select the processes to be monitored.
APM collects the index data for the monitored processes during the next host polling, which includes the
CPU usage ratio and memory usage ratio. The monitored processes and the corresponding index data
are displayed in the Process area, as shown in
Figure 67 Process area layout
Process area fields:
•
Config—Click the Config icon
to select the processes to be monitored in the monitor list
window.
•
Name—Name of the monitored process. APM can respectively collect index data for the processes
that have the same name, but different in Process Identifier (PID).
•
CPU Usage—CPU usage ratio of the monitored process in the last APM polling period.
{
Set Threshold —Click the Set Threshold icon
to set alarm thresholds of the CPU usage ratio
for the monitored process. The data is highlighted in orange when the CPU usage ratio reaches
the level-1 threshold, and is highlighted in red when the CPU usage ratio reaches the level-2
threshold. Use the global thresholds or custom thresholds. For information about setting the
thresholds, see "
{
History Record—Click the History Record icon
to view the history graph of the CPU usage
ratio of the monitored process. Point to a spot on the curve to view the data at the specific time
point. Authorized users can view CPU usage statistics over the last 1 hour, last 6 hours, today,
yesterday, this week, this month, and this year by clicking the corresponding icons. You can
only view historical index data of a process that has a unique process name.
•
Memory Usage—Memory usage ratio of the monitored process in the last APM polling period.
{
History Record—Click the History Record icon
to view the history graph of the memory
usage ratio of the monitored process. Point to a spot on the curve to view the data at the specific
time point. Authorized users can view memory usage statistics over the last 1 hour, last 6 hours,
today, yesterday, this week, this month, and this year by clicking the corresponding icons. You
can only view historical index data of a process that has a unique process name.
I/O State
APM can monitor the I/O status of the disk drivers in the AIX system, as shown in
.