Thread information, Class information – H3C Technologies H3C Intelligent Management Center User Manual
Page 619
605
Thread Information
The Thread Information area layout is shown in
.
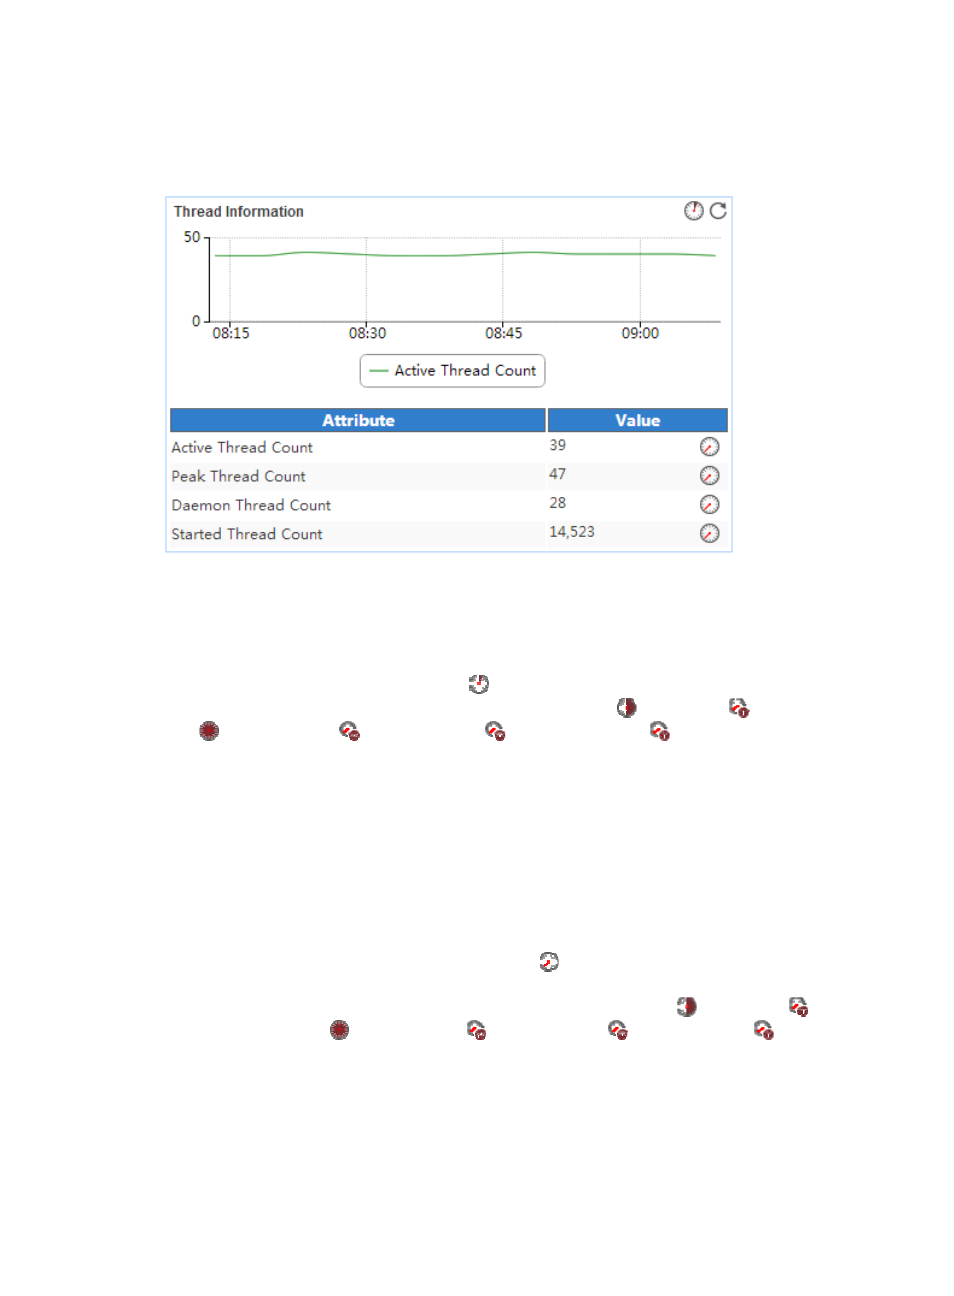
Figure 508 Thread Information area layout
Thread Information area fields:
•
Active thread trend graph—Shows changes of the active threads on the host where ActiveMQ is
deployed in a line graph. By default, the graph shows the last 1 hour statistics. Point to a spot on the
curve to view the change trend of the OS memory usage at the specific time point. To change the
report period, click the Last 1 Hour icon
on the upper right of the graph, and then select an icon
from the list. Available options include the Last 6 Hours icon
, Today icon
, Yesterday icon
, This Week icon
, This Month icon
, and This Year icon
.
•
Attribute/Value—Monitor index name and data:
{
Active Thread Count—Number of active threads generated by ActiveMQ in the last APM
polling period.
{
Peak Thread Count—Maximum number of active threads generated by ActiveMQ from time
when ActiveMQ was started to the time when APM last polled the ActiveMQ application.
{
Daemon Thread Count—Number of daemon threads generated by ActiveMQ in the last APM
polling period.
{
Started Thread Count—Number of threads started by ActiveMQ in the last APM polling period.
{
History Record—Click the History Record icon
to view the active thread change trend on the
host where Active MQ is deployed in a line graph. By default, the graph shows the last 1 hour
statistics. To change the report period, click the Last 6 Hours icon
, Today icon
,
Yesterday icon
, This Week icon
, This Month icon
, or This Year icon
on the upper
right of the graph as needed.
Class Information
The Class Information area layout is shown in