Application traffic, Network interface – H3C Technologies H3C Intelligent Management Center User Manual
Page 218
204
process reaches the level-2 threshold. You can set global thresholds or custom thresholds. For
information about setting the thresholds, see "
{
History Record—Click the History Record icon
to view the history graph of the CPU usage
of the zombie process in last 1 hour, last 6 hours, today, yesterday, this week, this month, or this
year.
•
Memory Usage—Memory usage of the zombie process in the most recent polling interval.
{
History Record—Click the History Record icon
to view the history graph of the memory
usage of the zombie process in last 1 hour, last 6 hours, today, yesterday, this week, this month,
or this year.
•
CPU Time—Duration that the zombie process occupies the CPU in the most recent polling interval.
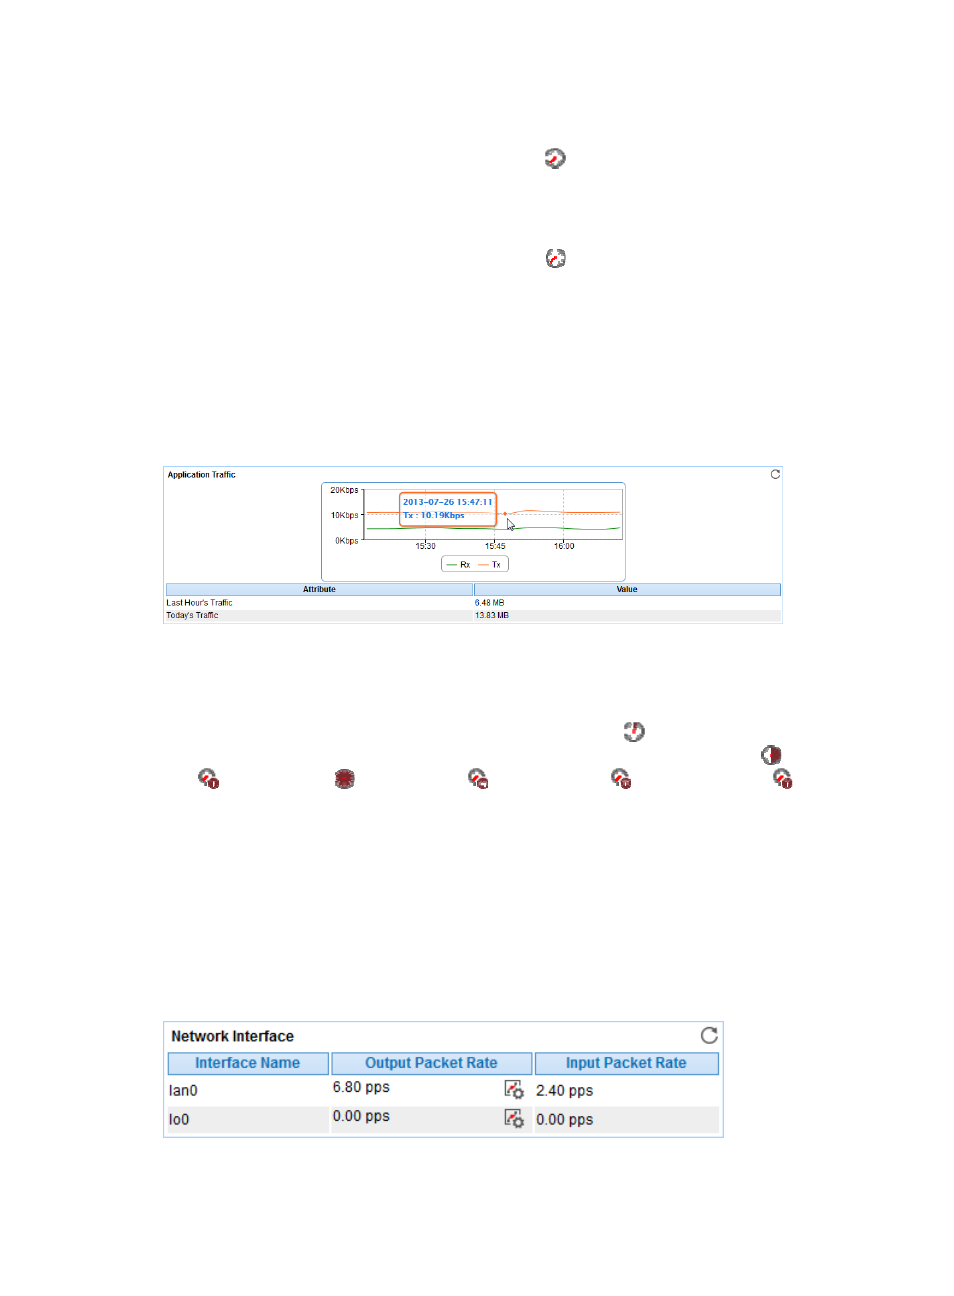
Application Traffic
APM collects HP-UX traffic based on the IP address of the host where the application resides. The
Application Traffic area layout is shown in
.
Figure 154 Application Traffic area layout
Application Traffic area fields:
•
Application Traffic trend graph—Shows changes of inbound and outbound HP-UX traffic over the
last 1 hour. The green curve shows the inbound traffic and the orange curve shows the outbound
traffic. To change the report period, click the Last 1 Hour icon
on the upper right of the graph,
and then select an icon from the list. Available options include the Last 6 Hours icon
, Today icon
, Yesterday icon
, This Week icon
, This Month icon
, and This Year icon
. Point to a
spot on the curve to view the application traffic at the specific time point. Click Rx or Tx to display
or hide the corresponding monitor index in the graph.
•
Attribute/Value—Monitor index name and data that was obtained when APM last polled HP-UX.
{
Last Hour's Traffic—Total traffic sent and received by HP-UX over the last 1 hour.
{
Today's Traffic—Total traffic sent and received by HP-UX since 00:00 today.
Network Interface
The Network Interface area layout is shown in
Figure 155 Network Interface area layout
Network Interface area fields: