System load, N in, Figure 168 – H3C Technologies H3C Intelligent Management Center User Manual
Page 233
219
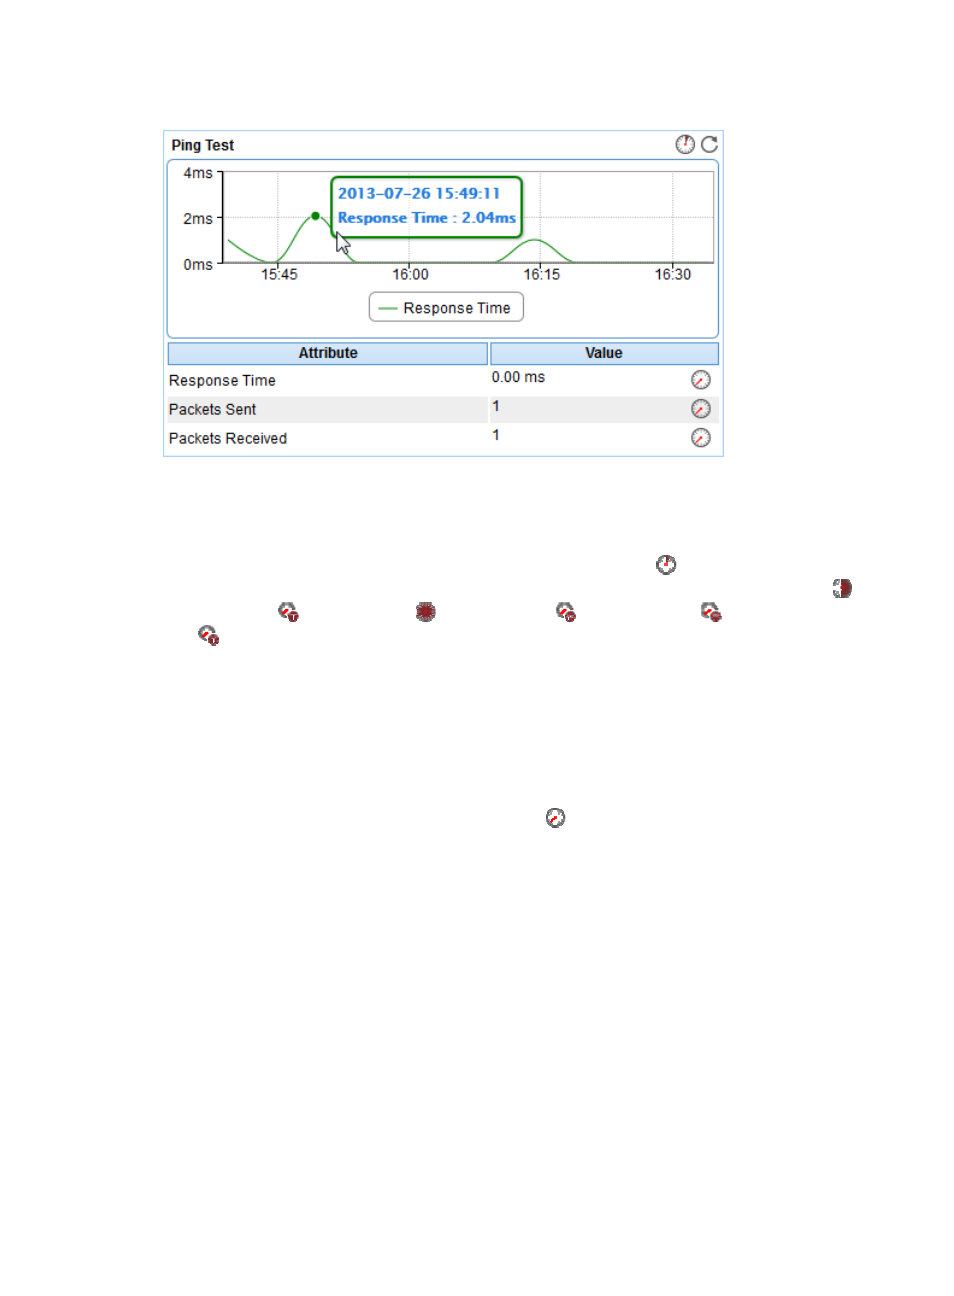
Figure 168 Ping Test area layout
Ping Test area fields:
•
Response Time trend graph—Shows the trend of the round trip response time of the Linux
application over the last 1 hour. Point to a spot on the curve to view the response time at the specific
time point. To change the report period, click the Last 1 Hour icon
on the upper right of the
graph, and then select an icon from the list. Available options include the Last 6 Hours icon ,
Today icon
, Yesterday icon
, This Week icon
, This Month icon
, and This Year icon
.
•
Attribute/Value—Monitor index name and data.
{
Response Time—Round trip response time of the Linux application in the last ping operation.
{
Packets Sent—Number of ICMP packets that are sent in the last ping operation. The maximum
number is 3.
{
Packets Received—Number of ICMP response packets that are received in the last ping
operation, which is 0 or 1.
{
History Record—Click the History Record icon
to view the history trend graph of the ping
test data (including the response time, the packets sent, and the packets received). Point to a
spot on the curve to view the data at the specific time point. Authorized users can view statistics
over the last 1 hour, last 6 hours, today, yesterday, this week, this month, and this year by
clicking the corresponding icons.
System Load
APM counts the average system load over 1 minute, 5 minutes, and 15 minutes. The average system load
records the average number of processes in the run queue over a specific time interval. An overloaded
system results in severe performance issues. The load threshold value varies with CPUs.
The System Load area layout is shown in