Network interface statistics, N in, Figure 597 – H3C Technologies H3C Intelligent Management Center User Manual
Page 693
679
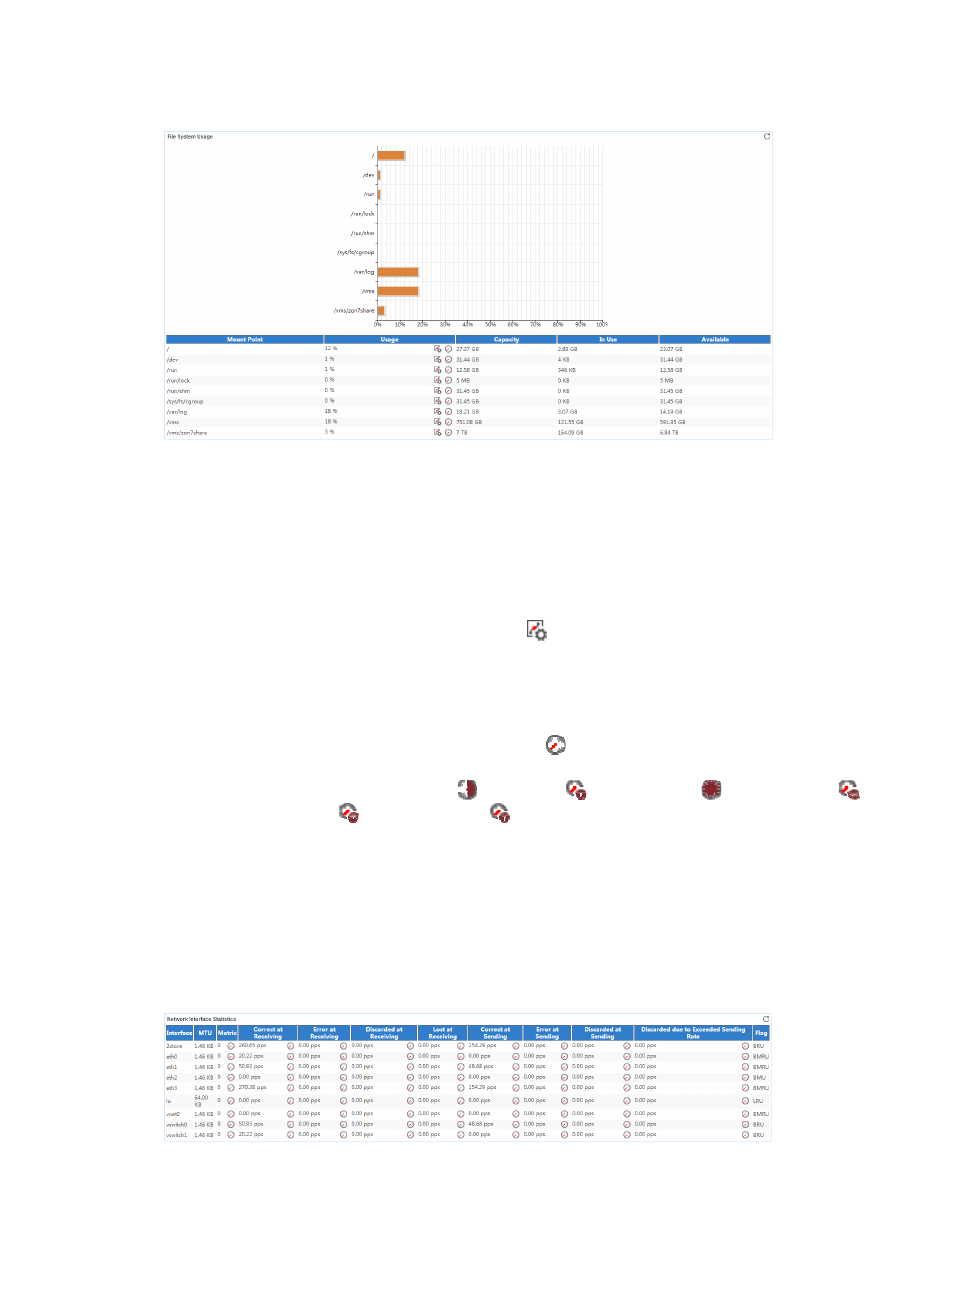
Figure 597 File System Usage area layout
File System Usage area fields:
•
File System Usage horizontal bar chart—Shows the space usage ratio of each mount point in the
last APM polling period. Point to a spot in a bar to view the space usage ratio of the specified mount
point.
•
Mount Point—Mount point of the file system in the operating system directory structure.
•
Usage—Space usage ratio of the file system.
{
Set Threshold—Click the Set Threshold icon
to set alarm thresholds for the CAS file system
usage ratio. The data is highlighted in orange when the file system usage ratio reaches the
level-1 threshold, and is highlighted in red when the file system usage ratio reaches the level-2
threshold. Use the global thresholds or custom thresholds. For information about setting
thresholds, see "
{
History Record—Click the History Record icon
to view the history graph of the file system
usage ratio trend. By default, the graph shows the last hour statistics. To change the report
period, click the Last 6 Hours icon ,
Today icon ,
Yesterday icon ,
This Week icon ,
This Month icon ,
or
This Year icon
on the upper right of the graph as needed.
•
Capacity—Capacity of the file system.
•
In Use—Used space of the file system in the last polling period.
•
Available—Unused space of the file system in the last polling period.
Network Interface Statistics
The Network Interface Statistics area layout is shown in
.
Figure 598 Network Interface Statistics area layout
Network Interface Statistics area fields: