Application traffic, Figure 433 – H3C Technologies H3C Intelligent Management Center User Manual
Page 539
525
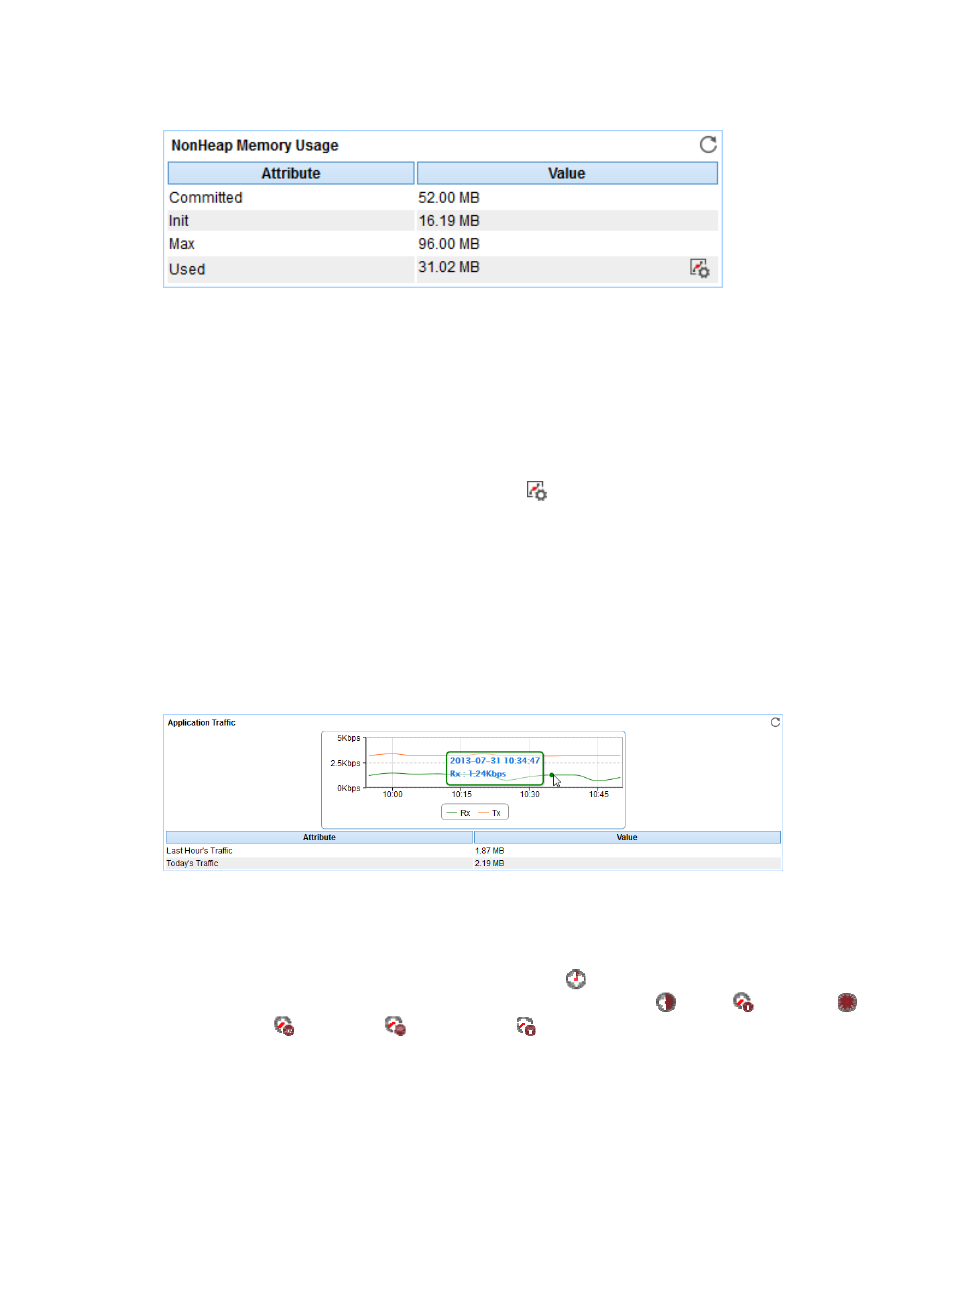
Figure 433 NonHeap Memory Usage area layout
NonHeap Memory Usage area fields:
•
Attribute/Value—Monitor index name and data.
{
Committed—Committed non-heap memory when JVM starts.
{
Init—Initial non-heap memory.
{
Max—Maximum non-heap memory.
{
Used—Non-heap memory being used.
{
Set Threshold—Click the Set Threshold icon
to set alarm thresholds for the used memory.
The data is highlighted in orange when the used memory reaches the level-1 threshold, and is
highlighted in red when the used memory reaches the level-2 threshold. Use the global
thresholds or custom thresholds. For information about setting the thresholds, see "
Application Traffic
APM collects JRE application traffic of the JavaRuntime host. The Application Traffic area layout is shown
in
.
Figure 434 Application Traffic area layout
Application Traffic area fields:
•
Application Traffic trend graph—Shows changes of inbound and outbound traffic over the last 1
hour. The green curve shows the inbound traffic and the orange curve shows the outbound traffic.
To change the report period, click the Last 1 Hour icon
on the upper right of the graph, and then
select an icon from the list. Available options include Last 6 Hours
, Today
, Yesterday
,
This Week
, This Month
, and This Year
. Point to a spot on the curve to view the
application traffic at the specific time point. Click Rx or Tx to display or hide the corresponding
monitor index in the graph.
•
Attribute/Value—Monitor index name and data that was obtained when APM last polled
JavaRuntime.
{
Last Hour's Traffic—Total traffic sent and received by JavaRuntime over the last 1 hour.
{
Today's Traffic—Total traffic sent and received by JavaRuntime since 00:00 today.