Memory usage ratio – H3C Technologies H3C Intelligent Management Center User Manual
Page 231
217
highlighted in red when the CPU usage ratio reaches the level-2 threshold. Use the global
thresholds or custom thresholds. For information about setting the thresholds, see "
{
History Record—Click the History Record icon
to view the history graph of the CPU usage
ratio trend. Point to a spot on the curve to view the CPU usage ratio at the specific time point.
Authorized users can view CPU usage ratio statistics over the last 1 hour, last 6 hours, today,
yesterday, this week, this month, and this year by clicking the corresponding icons on the upper
right of the graph.
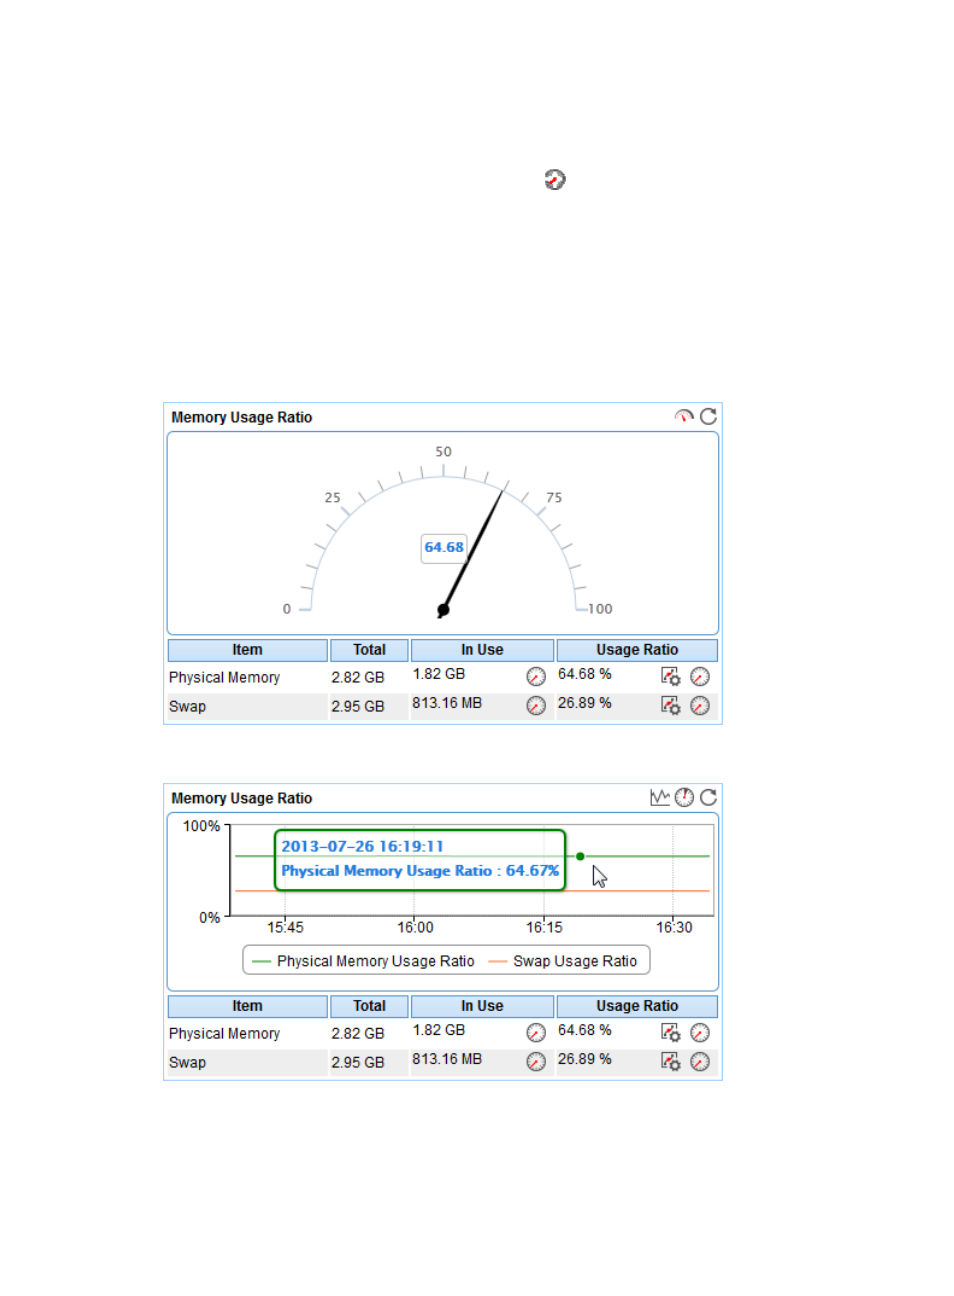
Memory Usage Ratio
The Memory Usage Ratio pane is shown in a dashboard (see
) or trend graph (see
).
Figure 166 Memory Usage Ratio—Dashboard area layout
Figure 167 Memory Usage Ratio—Trend graph area layout
Memory Usage Ratio area fields: