H3C Technologies H3C Intelligent Management Center User Manual
Page 617
603
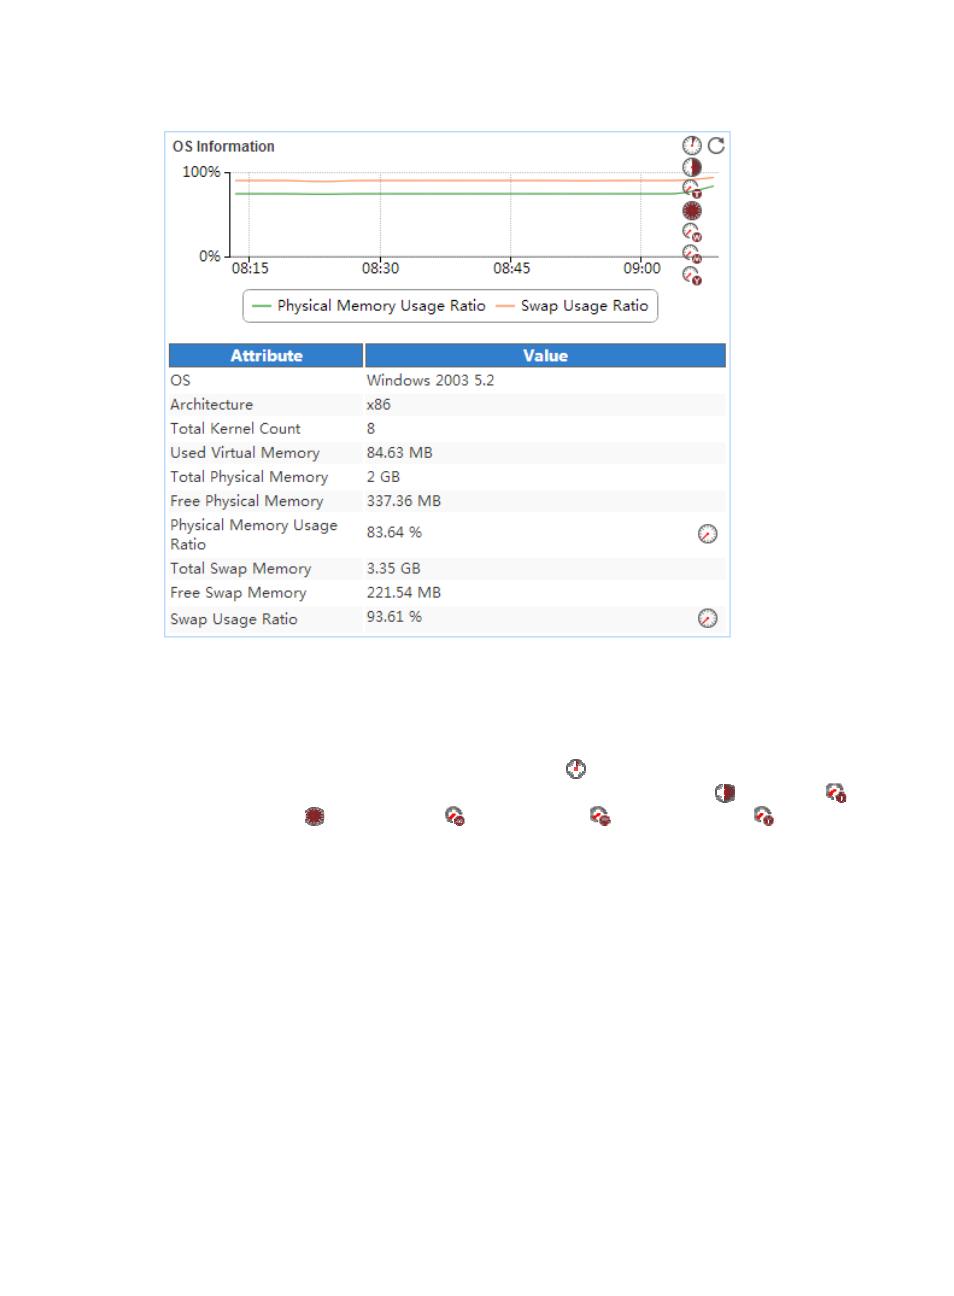
Figure 506 OS Information area layout
OS Information area fields:
•
OS memory usage trend graph—Shows changes of the OS memory usage on the host where
ActiveMQ is deployed in a line graph. By default, the graph shows the last 1 hour statistics. Point
to a spot on the curve to view the change trend of the OS memory usage at the specific time point.
To change the report period, click the Last 1 Hour icon
on the upper right of the graph, and then
select an icon from the list. Available options include the Last 6 Hours icon
, Today icon
,
Yesterday icon
, This Week icon
, This Month icon ,
and
This Year icon
.
•
Attribute/Value—Monitor index name and data:
{
OS—OS of the host where ActiveMQ is deployed.
{
Architecture—Architecture of the host where ActiveMQ is deployed.
{
Total Kernel Count—Total number of CPU kernels on the host where ActiveMQ is deployed.
{
Used Virtual Memory—Used virtual memory size of the OS on the host where ActiveMQ is
deployed in the last APM polling period.
{
Total Physical Memory—Total physical memory size of the OS on the host where ActiveMQ is
deployed.
{
Free Physical Memory—Free physical memory size of the OS on the host where ActiveMQ is
deployed in the last APM polling period.
{
Physical Memory Usage Ratio—Usage of the physical memory on the host where ActiveMQ is
deployed in the last APM polling period.
{
Total Swap Memory—Total swap memory size on the host where ActiveMQ is deployed.