Availability today – H3C Technologies H3C Intelligent Management Center User Manual
Page 663
649
•
IP Address—IP address of the Hyper-V server.
•
Application Type—Type of the monitored application. It is always Hyper-V for a Hyper-V
application monitor.
•
Version—Version of the Hyper-V server.
•
Last Polling Time—Time when APM last polled the Hyper-V server.
•
Relationship—Click the Relationship icon
to view dependencies between the Hyper-V server
and other applications in a dependency topology view. For more information about dependency
topologies, see "
4 Topology and application group management
•
Top5 Unrecovered Alarm—Latest five unrecovered alarms on the Hyper-V server. This field does not
appear if no alarm is generated by the Hyper-V server.
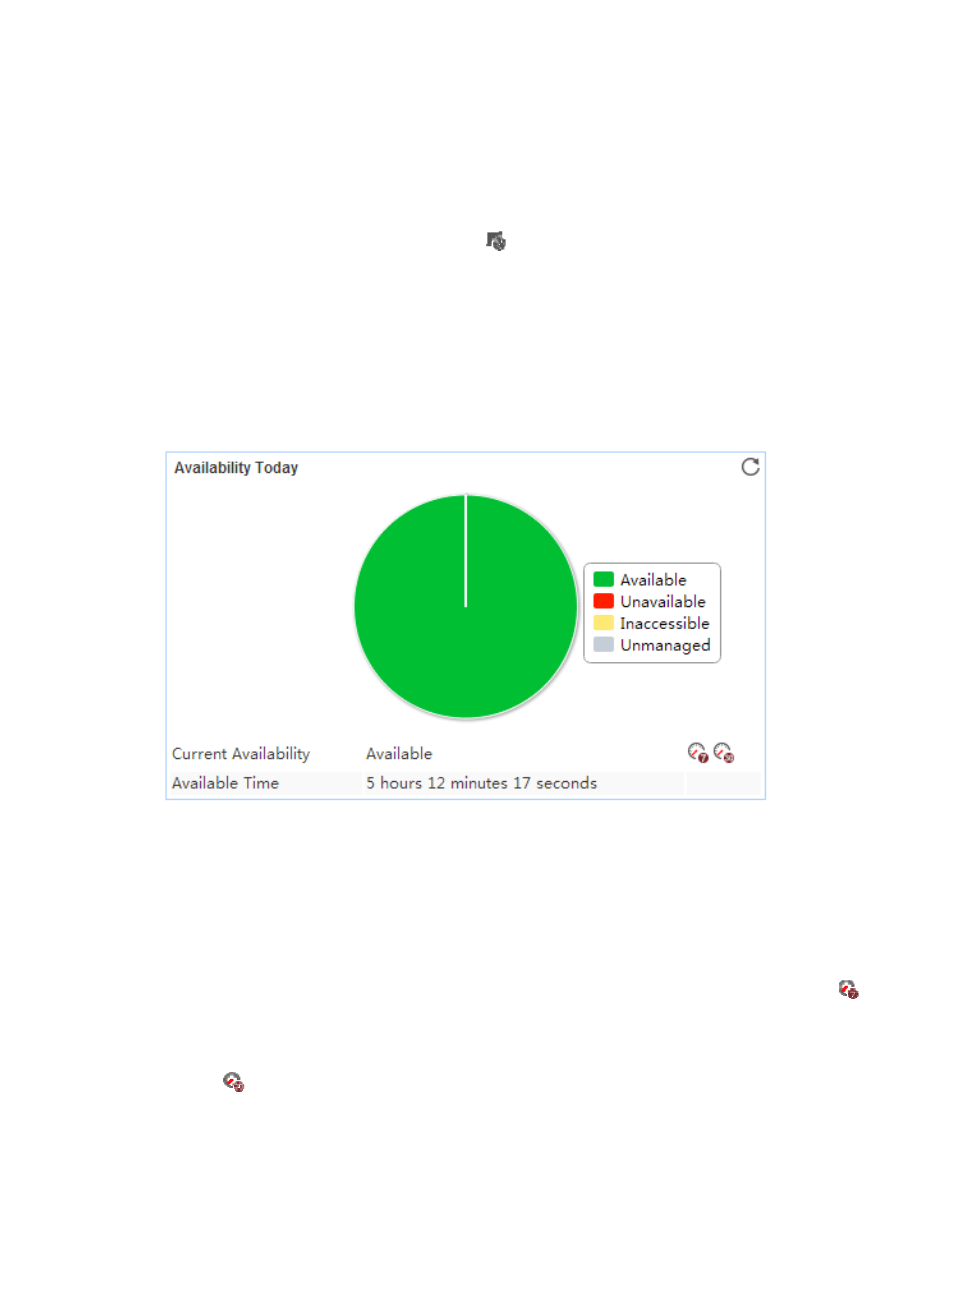
Availability Today
The Availability Today area layout is shown in
.
Figure 555 Availability Today area layout
Availability Today area fields:
•
Availability pie chart—Shows time duration percentages of the availability states
for the Hyper-V
server today. The availability states include Available, Unavailable, Inaccessible, and Unmanaged.
To view the time duration percentage of a specific availability state, place the cursor over the
corresponding slice in the chart.
•
Current Availability—Availability of the Hyper-V server in the last polling period.
{
To view the availability of the Hyper-V server in the last 7 days, click the Weekly History icon
.
The weekly availability data is collected hourly. To view the time duration percentages of
availability states in a specific period of time, point to that time.
{
To view the availability of the Hyper-V server in the last 30 days, click the Monthly History icon
. The monthly availability data is collected daily. To view the time duration percentages of
availability states on a specific day, point to that day.
•
Available Time—Total available time duration of the Hyper-V server since 00:00 today.
•
Unavailable Time—Total unavailable time duration of the Hyper-V server since 00:00 today.