H3C Technologies H3C Intelligent Management Center User Manual
Page 37
23
Table 6 Description of the monitoring report fields
No. Description
1
Application monitor report information, including the application monitor name, a Health State icon
, and a Refresh icon
.
•
Click the Health State icon
to view the health status of the application. When the application is
unhealthy, you can click the icon to analyze the root cause.
•
Click the Refresh icon
to refresh data in the report. To prevent data from being frequently
refreshed, the icon disappears for several seconds after you click it.
2
Monitor Information area. Information in this area varies with application monitors.
3
Availability Today area.
4
Application monitor index area. Different types of applications have different monitor indexes.
5
Refresh icon
. Click the Refresh icon
to refresh data in a specific area.
6
Availability statistics icons, including a Weekly History icon
and a Monthly History icon
.
•
Click the Weekly History icon
to view availability statistics of the application in the last 7 days.
•
Click the Monthly History icon
to view availability statistics of the application in the last 30
days.
7
Time range icon that indicates the time range for generating the data graph, including the Last 1 Hour
icon
, Last 6 Hours icon
, Today icon
, Yesterday icon
, This Week icon
, This Month
icon ,
and
This Year icon
.
8
Monitor index-related icons, including a Set Threshold icon
and a History Record icon .
•
Click the Set Threshold icon
to set alarm thresholds for monitor indexes. By default, monitor
indexes use global thresholds.
•
Click the History Record icon
to view the history trend for the application in a line graph,
including Last 1 Hour icon
, Last 6 Hours icon
, Today icon
, Yesterday icon
, This
Week icon
, This Month icon
, and This Year icon
.
•
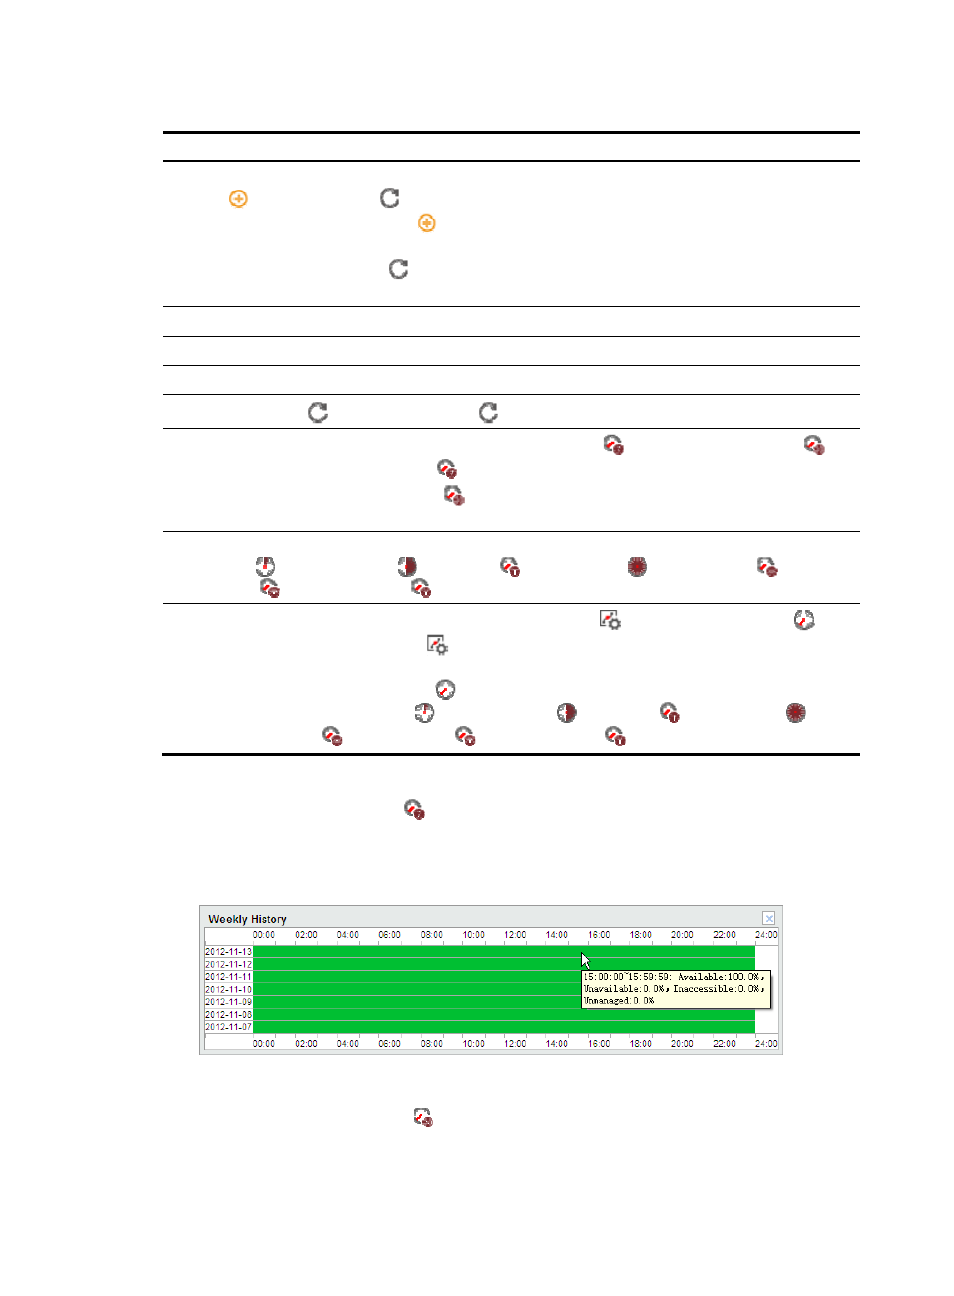
View the availability statistics of the application in the last 7 days
Click the Weekly History icon
to view availability statistics of the application in the last 7 days.
The data is collected hourly and you can point to the chart to view the summary of data collected
for a specific hour.
Figure 12 Weekly History
•
View availability statistics of the application in the last 30 days
Click the Monthly History icon
to view availability statistics of the application in the last 30
days. The data is collected daily and you can point to a cell of the chart to view the summary of
data collected for a specific day.