Web application – H3C Technologies H3C Intelligent Management Center User Manual
Page 348
334
custom thresholds. For more information about threshold setting, see "
{
History Record—Click the History Record icon
for a monitor index to view history trend
statistics of the total requests, successes, or errors in a line graph. Point to a spot on the curve to
view the data at the specific time point. Authorized users can view statistics over the last 1 hour,
last 6 hours, today, yesterday, this week, this month, and this year by clicking the corresponding
icons.
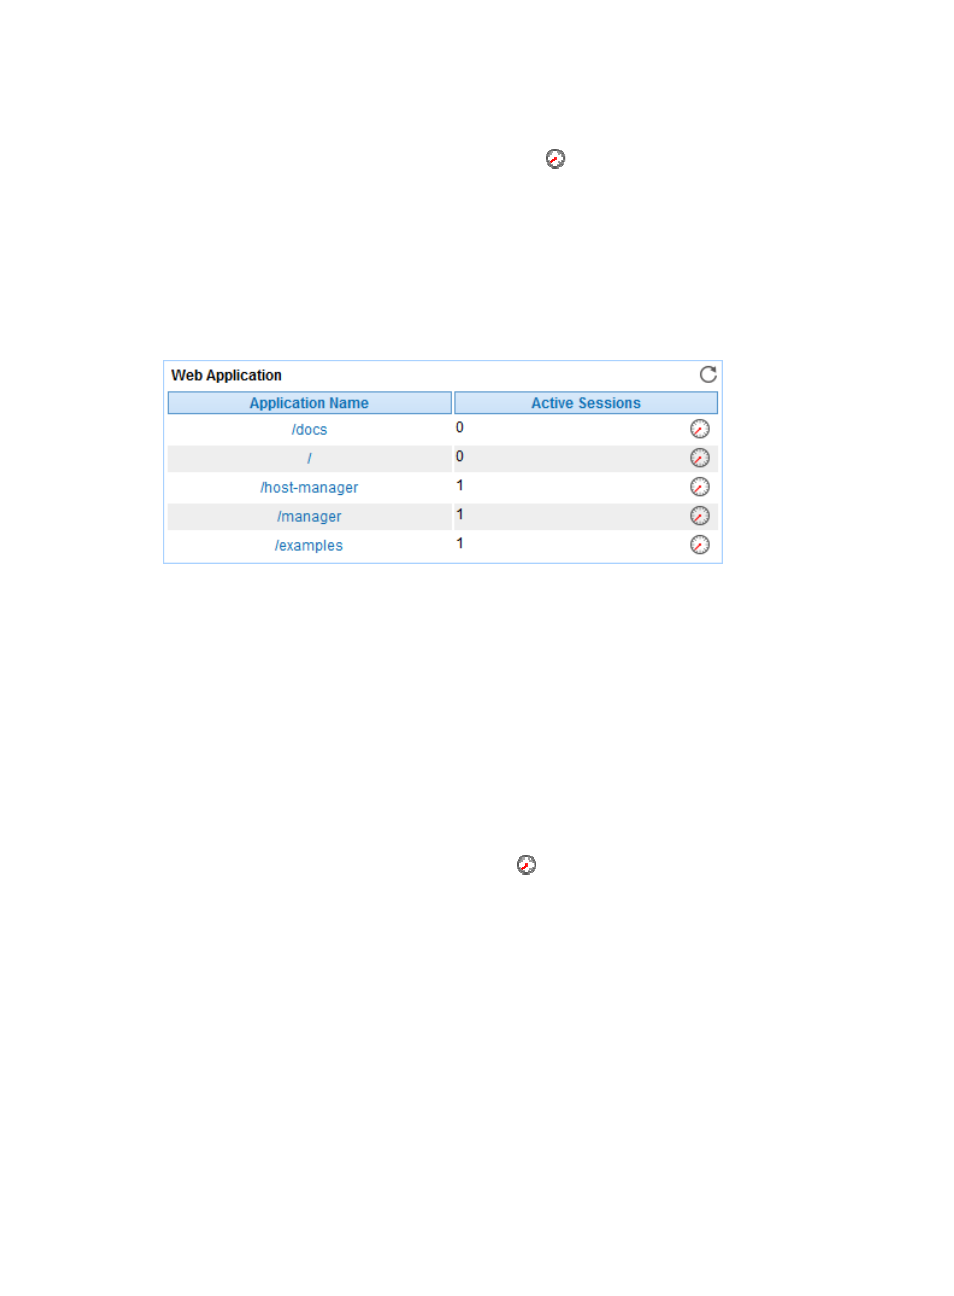
Web Application
The Web Application area is shown in
Figure 279 Web Application area layout
Web Application area fields:
•
Application Name—Name of the Web application deployed on the Tomcat server. Click the name
of a Web application (/docs in this example) to view its details, as shown in
.
{
URL—Web page and servlet of the Web application.
{
Name—Name of the Web application to which the URL belongs.
{
JSP Requests—Number of JSP requests received by the URL since the Tomcat server started in
the last polling interval.
{
Error Requests—Number of requests the URL received but failed to respond to.
{
Response Time—Total time taken by the URL to receive, execute, and respond to the request.
•
Active Sessions—Number of active sessions in the Web application in the last polling interval.
•
History Record—Click the History Record icon
for a Web application to view the history graph
of the active session count trend of the application. Point to a spot on the curve to view the active
session count at the specific time point. Authorized users can view the active session statistics over
the last 1 hour, last 6 hours, today, yesterday, this week, this month, and this year by clicking the
corresponding icons on the upper right of the graph.